The network for creativity
Join 1.25M professional creatives like you
Connect with clients, get discovered, and run your business 100% commission-free
Creatives on Contra have earned over $150M and we are just getting started
Back to feedPost

🚀 Building a Graph-Based Fraud Detection System with Neo4j
A single transaction may look normal. Its connections can tell a different story.
I’m building a learning project using Neo4j and Cypher to explore relationships between customers, accounts, transactions, and devices—and flag patterns worth investigating.
🔍 Patterns I’m exploring:
• Multiple customers sharing the same device
• Unusually large transactions
• Rapid transactions within a short period
• Multiple accounts sending money to one account
• Circular transfers between connected accounts
The focus is explainability: showing the relationships behind each flag so the suspicious activity is easier to understand.
Through this project, I’m strengthening my graph data modelling, Cypher queries, and rule-based detection skills.
Next: FastAPI integration, transaction risk scores, fraud alerts, and an interactive monitoring dashboard.
🛠️ Currently a learning prototype, with more updates coming as I build.
What would you investigate first: shared devices or circular transfers?
#Neo4j #GraphDatabase #FraudDetection #Cypher #BackendDevelopment #LearningInPublic



The network for creativity
Join 1.25M professional creatives like you
Connect with clients, get discovered, and run your business 100% commission-free
Creatives on Contra have earned over $150M and we are just getting started





Related posts

A few things we’ve been working on this month.
Different industries, different problems, but the same goal: making complex products feel simple, clear, and trustworthy.
Fintech → Investment Banking → Geospatial AI
More projects are still in progress.
Full case studies coming soon.


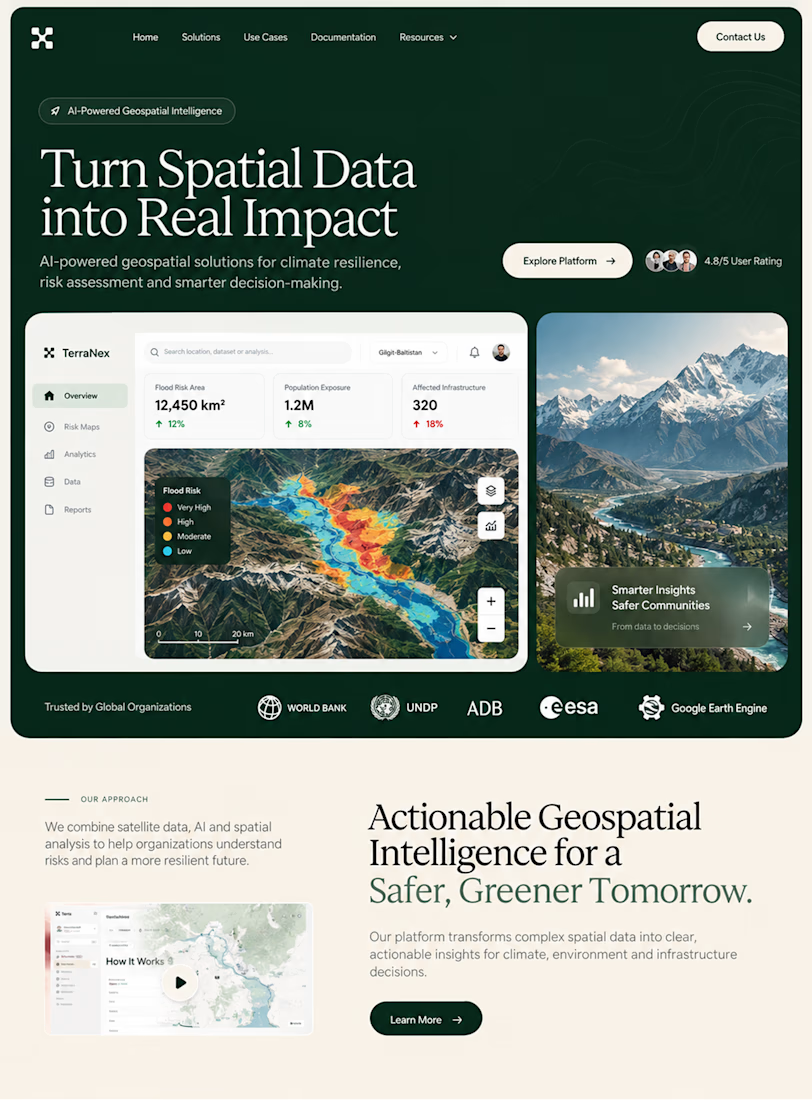

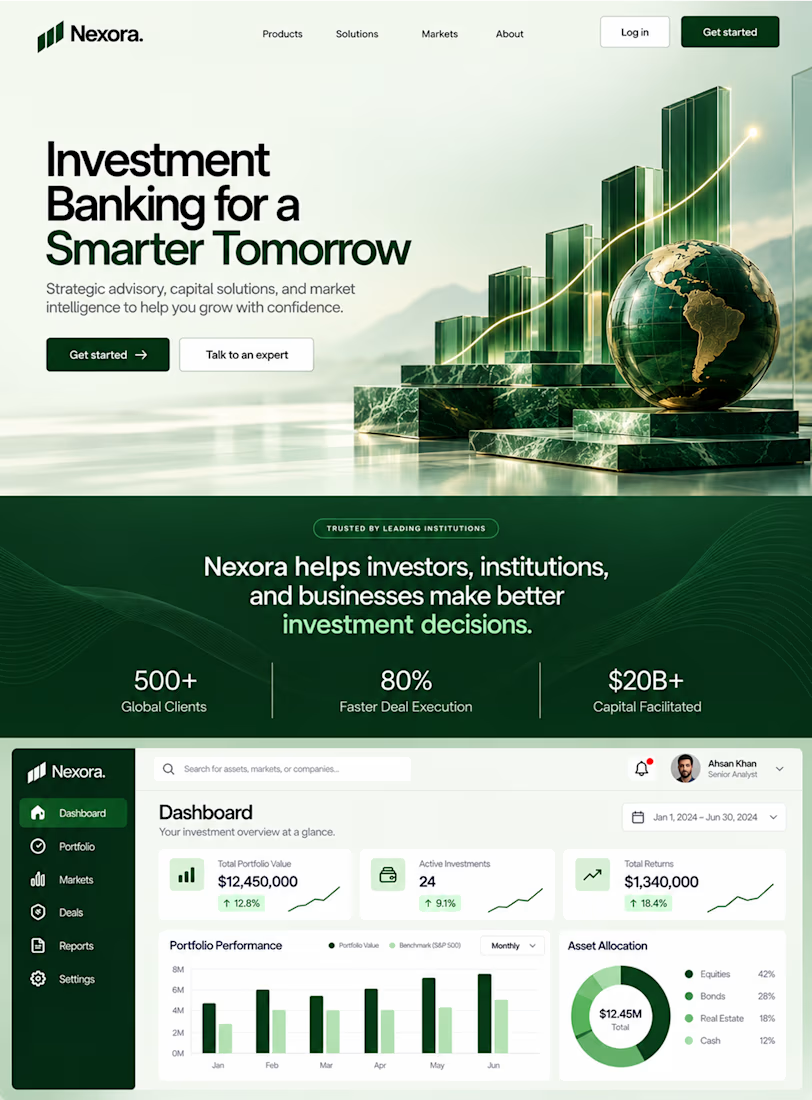

This is the kind of work I enjoy seeing — simple, focused, and actually thought through.

NetworkAI — AI-Powered Campus Network Monitoring System
A real-time network monitoring dashboard designed to help campus IT teams observe network health, monitor interfaces, and identify potential issues from a single interface.
What I built
Real-time network monitoring with live interface and system status
Network interface analytics showing traffic and connection activity
Historical monitoring data for analyzing network behavior over time
Live WebSocket communication for continuously updated monitoring data
Network controls to start and stop monitoring directly from the dashboard
Interactive charts and visualizations for easier interpretation of
network metrics
Responsive dashboard UI designed for clear monitoring rather than unnecessary complexity
FastAPI backend providing REST APIs and WebSocket communication
React frontend with a modern monitoring-focused interface
Why I built it
The goal was to create a practical campus network monitoring system that demonstrates how real-time networking data can be collected, processed, and presented through a modern web interface.


cool project bro. live data + history in one place is useful. how do you handle reconnecting when the websocket drops?

Then: 1 month, 1 template.
Now: 1 week, 15 templates.
Same designer, different workflow.
I wrote up how I built no-code.supply: fifteen website templates, each with its own brand, in HTML and React, and some in Framer too. Claude Code did most of the typing. I did the directing.

no-code.supply
How I built 15 website templates with an AI coding agent in a week
How I built 15 AI-ready website templates with Claude Code in a week: the workflow, the quality bar, and why a template is only the starting point.

Going from one template a month to fifteen a week is wild. How much of the design direction did you still do by hand?