The network for creativity
Join 1.25M professional creatives like you
Connect with clients, get discovered, and run your business 100% commission-free
Creatives on Contra have earned over $150M and we are just getting started
Back to feedPost

🚀 Introducing GraphBridge – Turn JSON into Grafana Dashboards
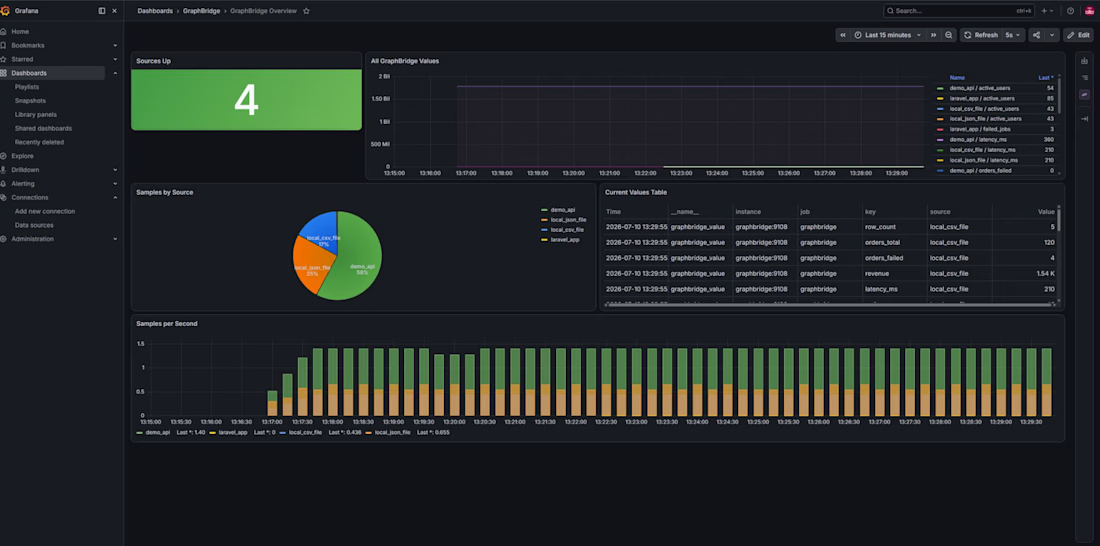
One thing I've noticed while working on different projects is that applications already have valuable metrics, but getting those metrics into Grafana often requires exporters, custom integrations, or additional setup.
I wanted something much simpler.
So I built GraphBridge.
The idea is straightforward:
Your Application
↓
Send JSON
↓
GraphBridge
↓
Prometheus
↓
Grafana
Instead of writing custom exporters, your application simply sends JSON metrics to GraphBridge.
For example:
{
"active_users": 85,
"orders_today": 42,
"revenue_today": 9840,
"failed_jobs": 3,
"latency_ms": 210
}
GraphBridge automatically converts the data into Prometheus metrics, making it immediately available for Grafana dashboards.
Current features
✅ JSON Webhook API
✅ REST API polling
✅ JSON & CSV data sources
✅ Prometheus /metrics endpoint
✅ Docker Compose deployment
✅ Auto-configured Grafana dashboard
✅ Example integrations for Laravel, FastAPI, Node.js, and custom applications
Possible use cases
• Application monitoring
• Queue & background job metrics
• Business dashboards
• API performance monitoring
• FFmpeg streaming statistics
• IoT sensor metrics
• Internal analytics
• Custom operational dashboards
The goal is simple:
Send JSON. Visualize everything.
This is the first public MVP, and I'm planning to continue improving it with additional integrations and monitoring templates.
I'd love your feedback and suggestions!
⭐ GitHub:
https://lnkd.in/dAYdNJxg


The network for creativity
Join 1.25M professional creatives like you
Connect with clients, get discovered, and run your business 100% commission-free
Creatives on Contra have earned over $150M and we are just getting started





Related posts

🏢 The Business & The "Greasy Hands" Dilemma:
We built DockFlow (Biscayne Marine OS) for Elena "Rico" Rossi, a solo mobile boat engine mechanic operating "Biscayne Mobile Marine" in Miami, Florida.
Elena drives a mobile workshop van to marinas and canal slips to repair high-performance boat engines (Yamaha, Mercury). But she faced a brutal daily dilemma:
The Greasy Hands Barrier: When working, both of her hands are covered in black engine grease inside noisy boat engine compartments. She physically cannot pick up her phone to answer customer calls.
The Traffic & No-Show Trap: Over 35% of boat owners would cancel after Elena had already driven 45 minutes across Miami bridge traffic in her work van.
Logistics Chaos: Between texting back and forth for marina security gate PINs, boat parking slip numbers, and checking if ocean tides were too shallow to run boat engines, Elena was losing 14+ hours every week just playing phone tag.
⚡ What We Built in Lovable:
We completely rebuilt the moment an inbound customer inquiry turns into a confirmed, paid booking without Elena ever touching her phone:
Marketing Landing Page (/): An executive business homepage with an interactive 3-slide hero carousel explaining the service, problems eliminated, and dockside repair guarantees.
Customer Fast-Track Booking (/book):
Real Microphone Voice Intake: Boaters stranded at a dock don't type long forms. They speak into their phone or record their engine's warning sound using HTML5 microphone capture, and the system extracts their boat specs and symptoms automatically.
Water Depth Safety Check: Verifies Biscayne Bay ocean tide levels (+1.8 ft flood tide) to ensure the water is deep enough to safely lower and test the boat engine without hitting mud.
Smart Neighborhood Routing: Groups appointments by marina cluster (Coconut Grove, Miami Beach) so Elena doesn't crisscross the city.
$175 Deposit Lock: Collects an upfront card deposit to eliminate no-shows.
Self-Service Reschedule & Cancel: Customers can reschedule or cancel in one tap without calling Elena.
Elena's Mission Control (/owner):
Sequential 1-2-3-4 Biscayne Bay route map.
Van Pre-Flight Inventory Matcher: Automatically checks Elena's van shelves (Bin 3B) for replacement cooling parts to guarantee 100% first-time fixes before she drives out.
One-tap status updates ("On the way", "Arrived", "Job Done") that send automated SMS updates to the customer.
Automatically archives completed repairs into a dedicated History & Invoices log.
Realtime Auto-Healing Waitlist Waterfall:
When a boater cancels last minute, a Supabase Realtime broadcast triggers an instant 5-minute countdown alert to the next standby boater in line (Capt. Marcus Vance), auto-filling the vacant spot with zero manual texting!
Miami Localization & Enterprise Polish:
Fully bilingual in English and Spanish (over 60% of South Florida boaters speak Spanish).
Light and Dark mode themes.
Powered by a scalable Supabase database backend.
📈 Measurable ROI:
⏱️ 14 Hours Saved Weekly in manual scheduling and phone tag.
🛡️ Zero No-Shows thanks to upfront card deposits.
🚗 2+ Hours Saved Daily in Miami bridge traffic via neighborhood clustering.
🔧 No Wasted Parts Runs with van inventory pre-flight matching.
Live App: https://dockflow-biscayne.lovable.app/
lovablechallengeFull Stack DevelopmentLow-Code/No-Code DevelopmentWeb DevelopmentLovableNext.jsSupabase


Amazing! Love the backstory and a female boat mechanic with greasy hands. Well done.

AI Code Performance Engineer is a developer tool I built to analyze codebases, identify performance bottlenecks, generate optimization candidates, verify correctness, and benchmark whether changes actually improve performance. It combines software performance engineering, automation, testing, CI/CD, and AI-assisted optimization into a single workflow focused on measurable results rather than speculative suggestions.


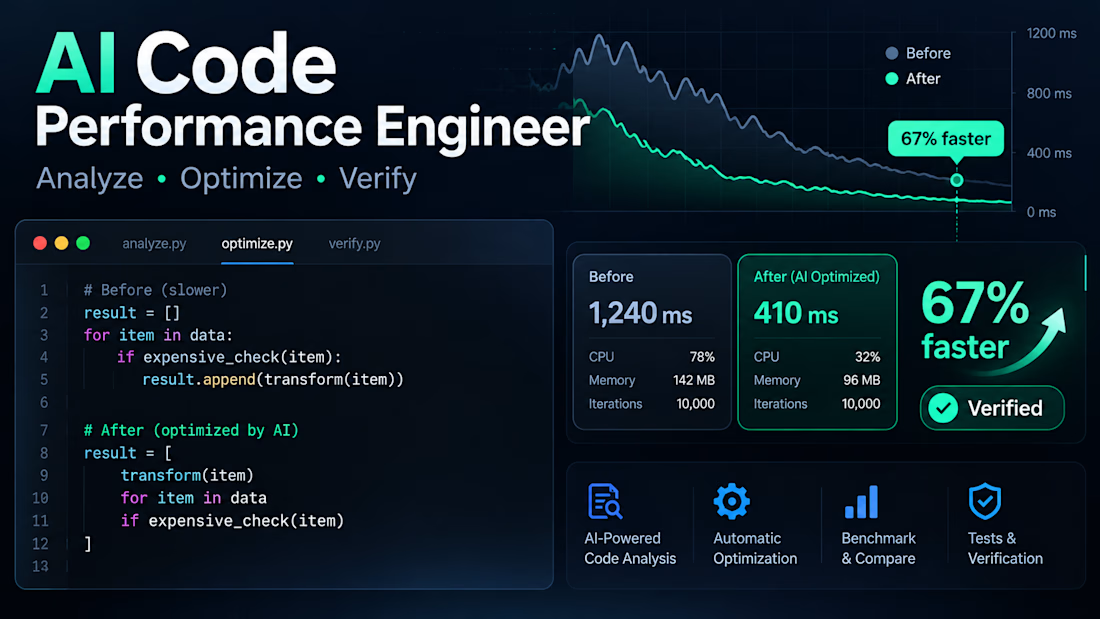

I'd run the baseline and AI-generated candidate on fixed inputs in the same benchmark job, then compare repeated timings and memory use after the correctness check. How are you filtering out CI runner noise before accepting a speedup?

Building AI agents is easy. Building one you can trust with a real business workflow is harder.
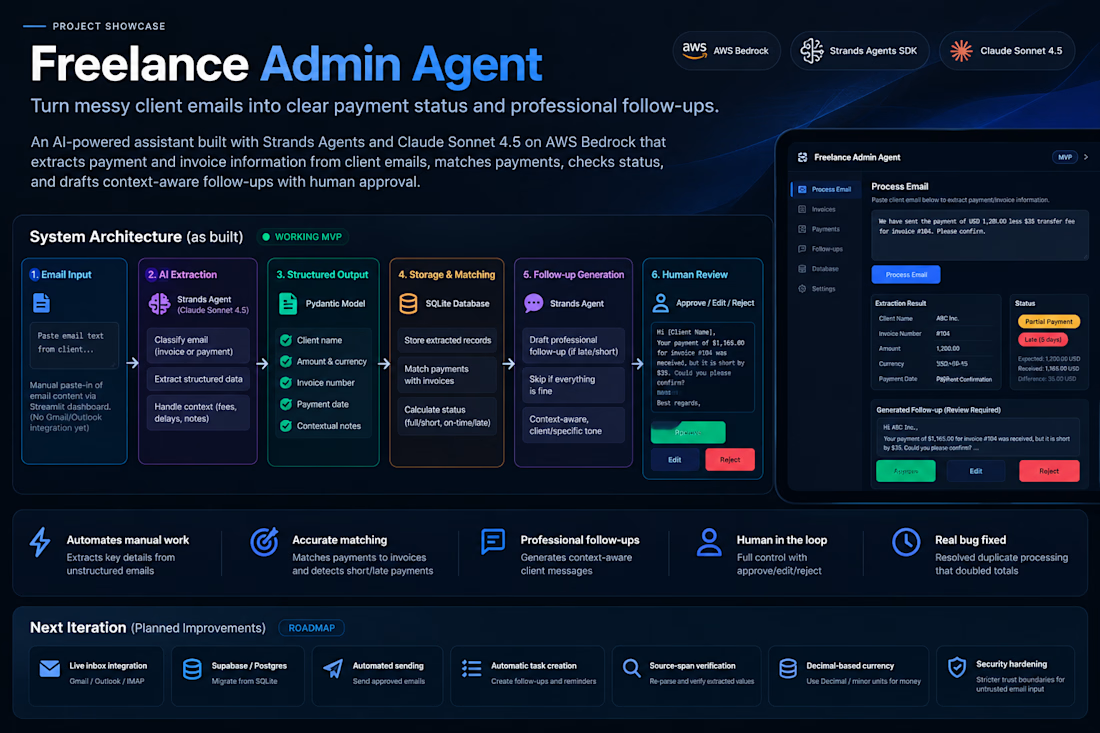
I built a Freelance Admin Agent to explore that problem using Strands Agents SDK and Claude Sonnet 4.5 on Amazon Bedrock.
The working MVP takes manually provided client emails and turns them into a structured payment workflow:
→ Classifies invoice and payment emails
→ Extracts client, invoice, amount, currency, dates and contextual details using structured output
→ Stores and matches records in SQLite
→ Uses deterministic logic to identify full/short and on-time/late payments
→ Uses a second agent to draft a contextual follow-up only when needed
→ Keeps the final decision with the human through Approve / Edit / Reject
One of the most valuable parts wasn't adding another AI feature. It was finding a real reliability issue during testing: reprocessing the same email could duplicate records and inflate payment totals.
I reproduced it through repeat testing, traced the database behavior, and fixed it.
That reinforced something I'm increasingly applying to my AI engineering work:
A useful AI product isn't just an LLM call. It needs clear boundaries between AI reasoning, structured data, deterministic business logic, persistence, testing, and human control.
The next iteration will focus on stronger production safeguards, including source-grounded financial extraction, precise currency handling, stricter trust boundaries for untrusted input, and eventually live inbox integrations.
I'm interested in building more systems like this for startups and teams with repetitive workflows that can genuinely benefit from AI agents and automation.
Stack: Python · Strands Agents SDK · Amazon Bedrock · Claude Sonnet 4.5 · Pydantic · SQLite · Streamlit

turning client emails into admin tasks is such a real freelancer pain, nice build 🔥