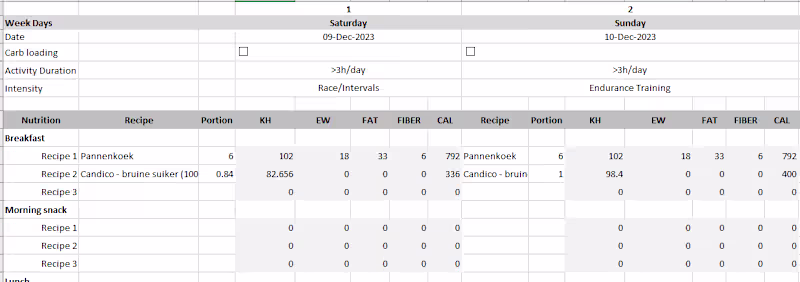
Skilled data entry expert delivering accurate and organized
Skilled data entry expert delivering accurate and organized

View more →
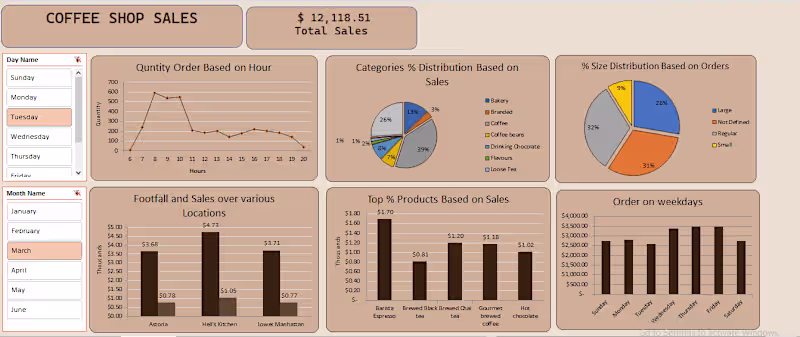
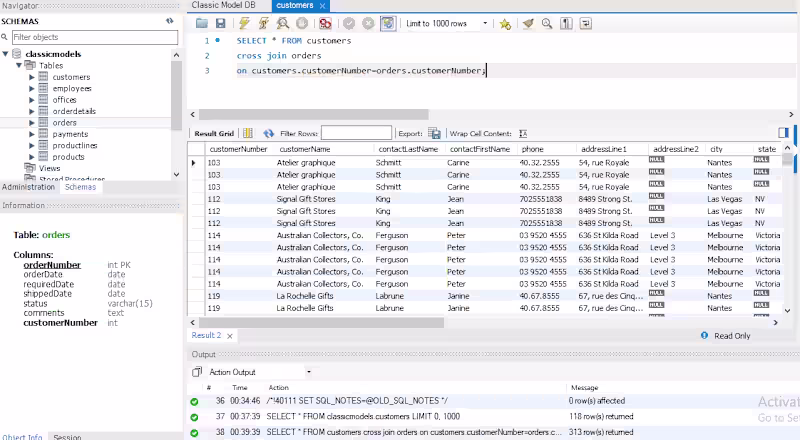
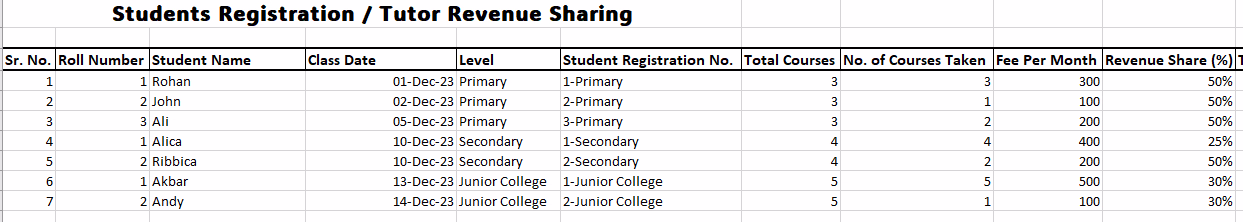
Expert Data Analyst specializing in Excel & SQL
Expert Data Analyst specializing in Excel & SQL

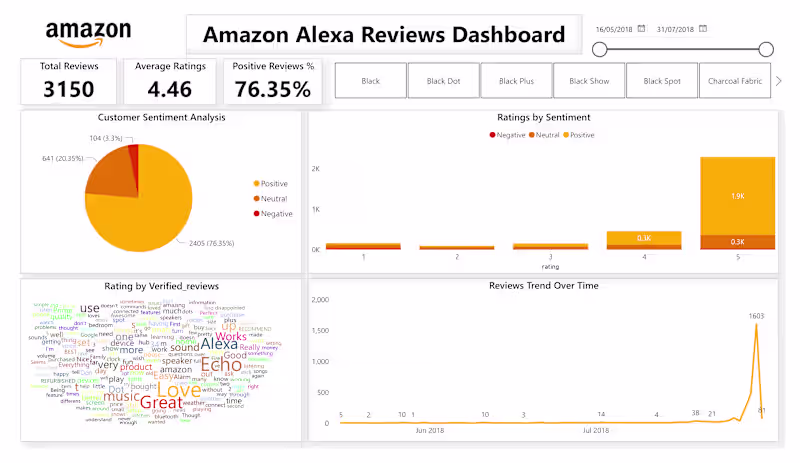
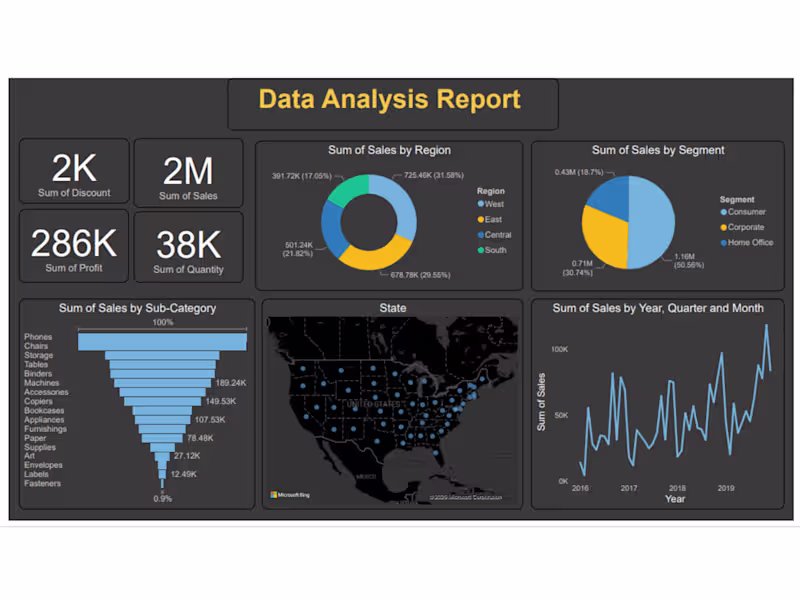
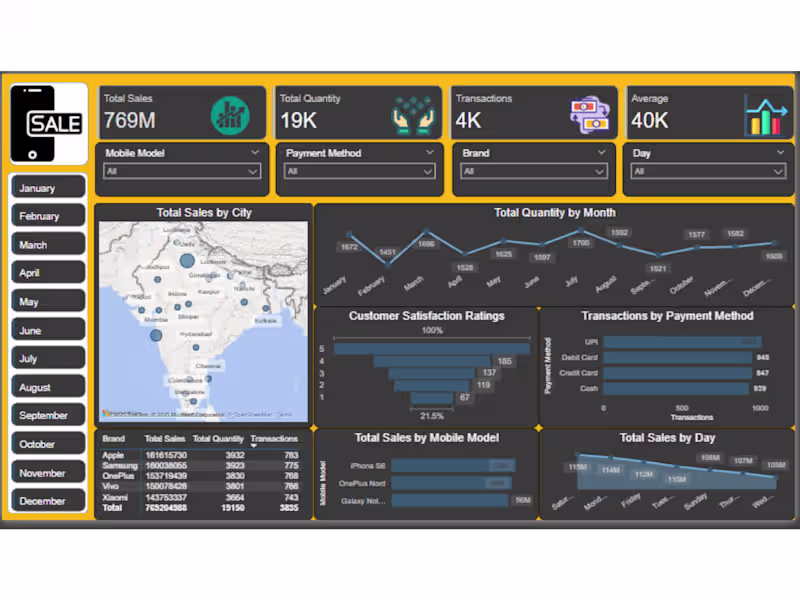
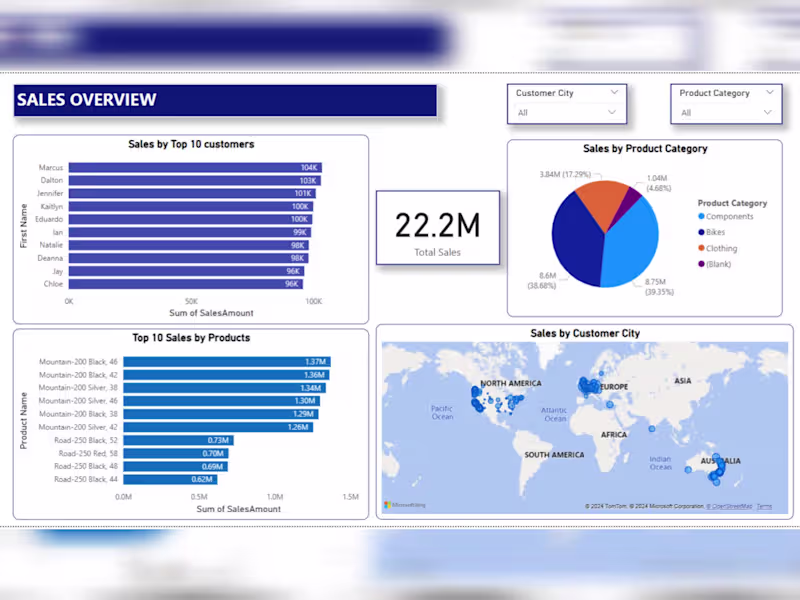
Data Analyst | Power BI Developer | Excel, SQL, Python
Data Analyst | Power BI Developer | Excel, SQL, Python
UX, Optimizing Operations & Virtual Assistance
UX, Optimizing Operations & Virtual Assistance


View more →
Software development and precise data management.


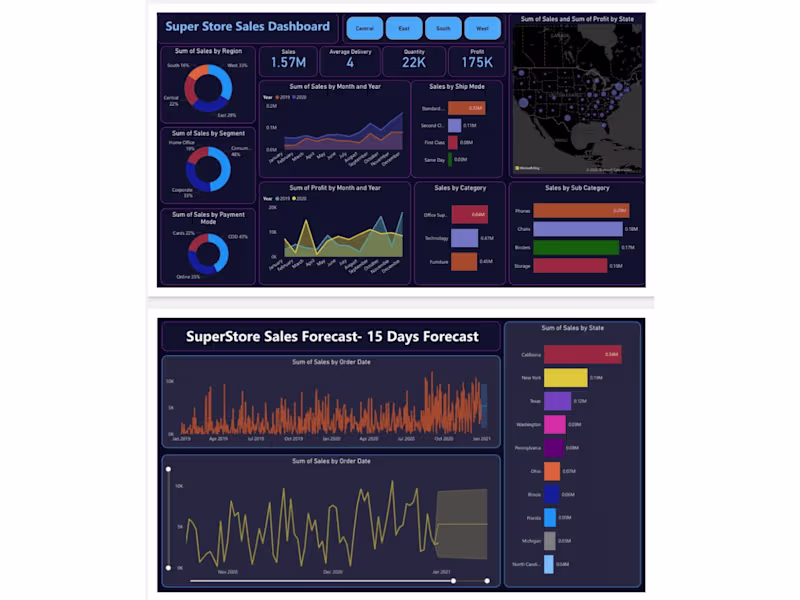
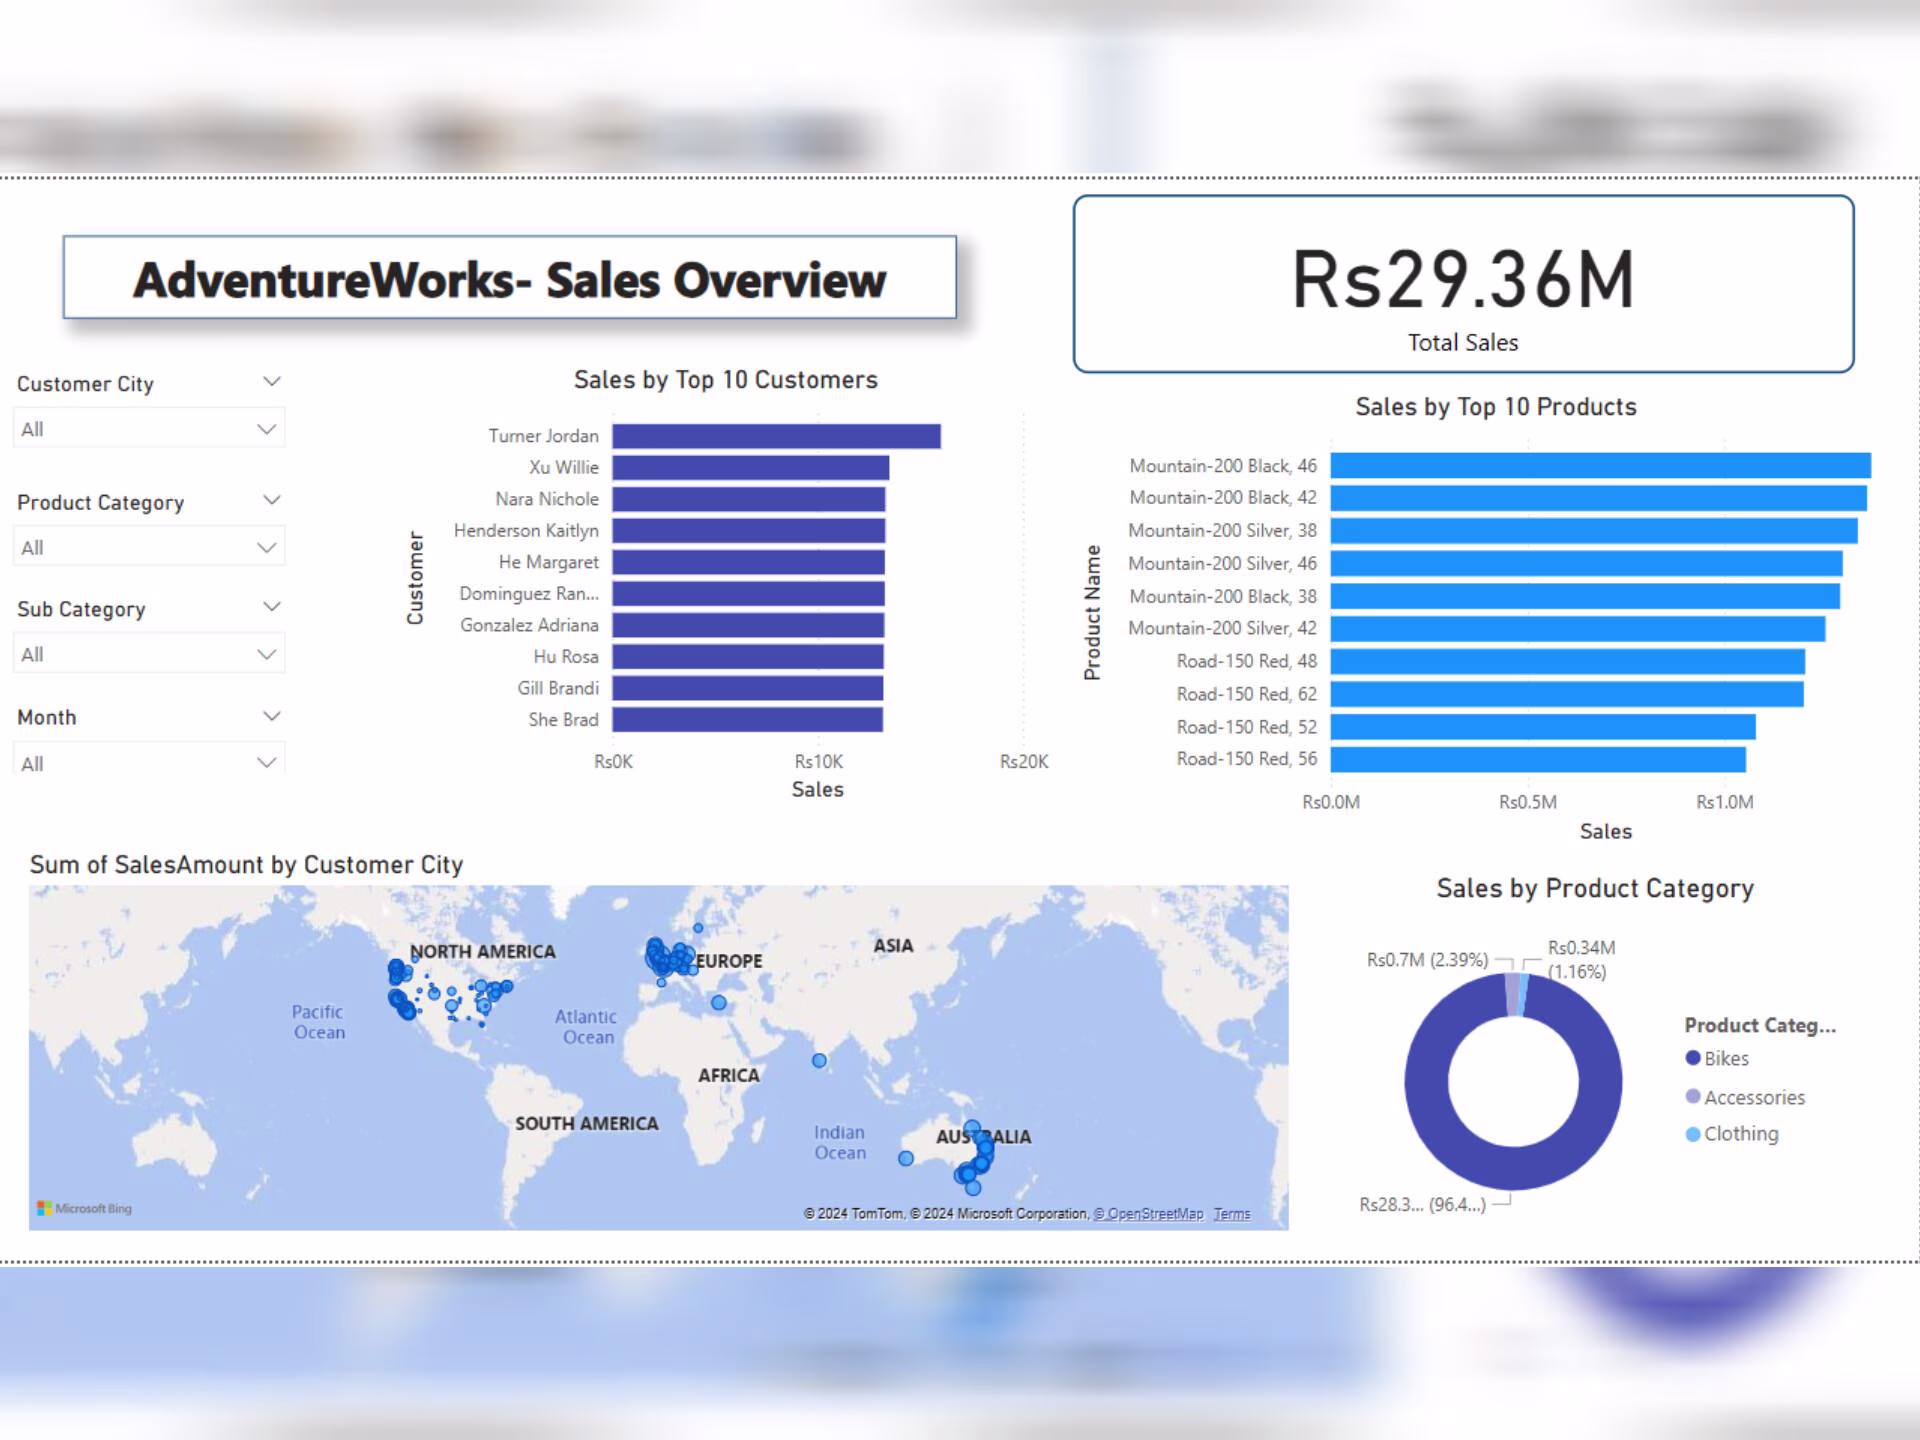
Data Analyst & Visualization Specialist 📊
Data Analyst & Visualization Specialist 📊
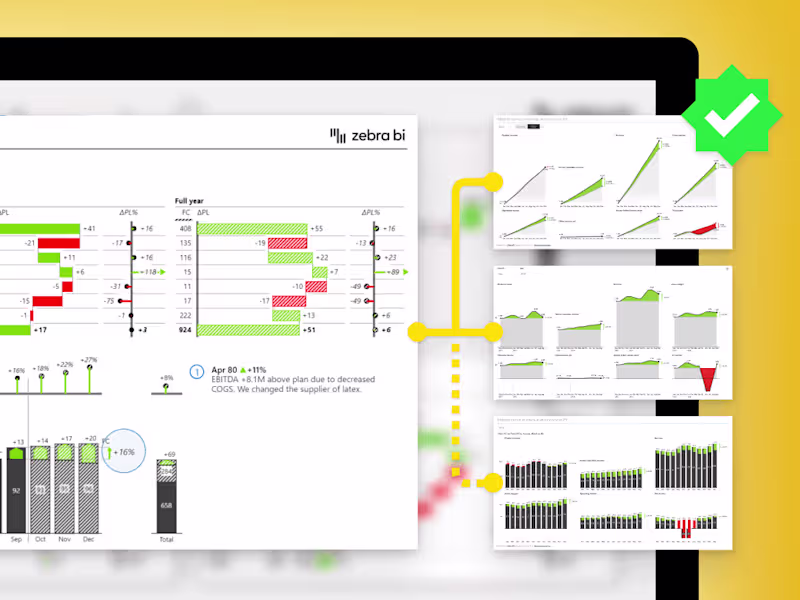
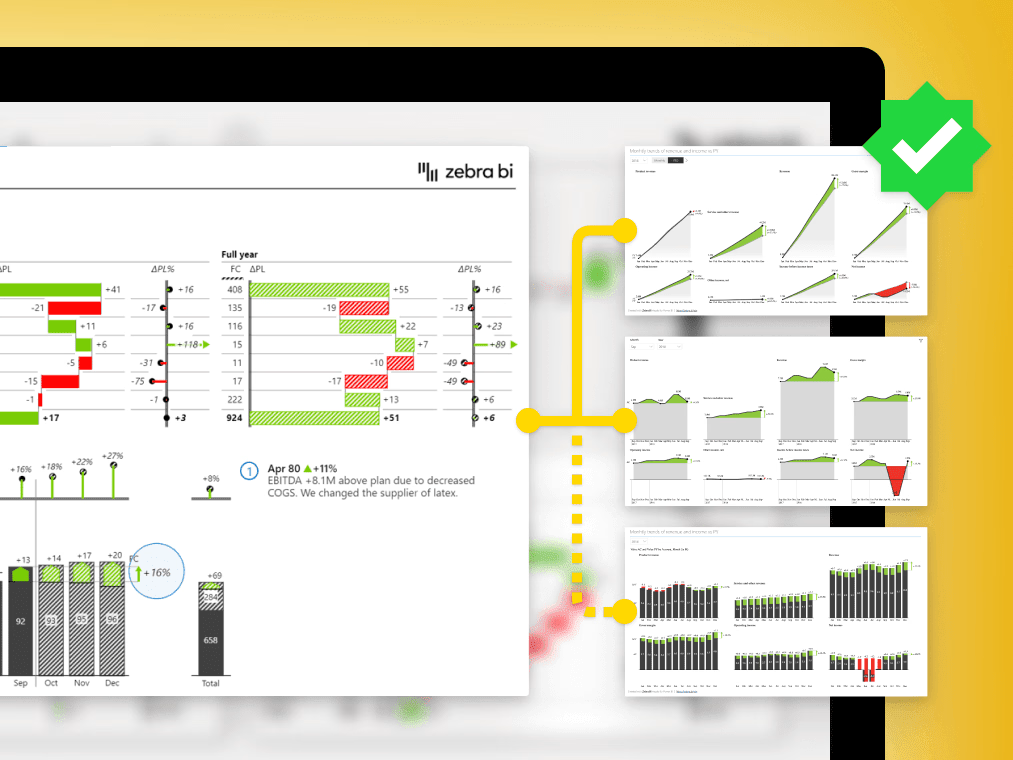
Power BI Developer & Data Analyst - Client Satisfaction
Power BI Developer & Data Analyst - Client Satisfaction


AI & Data Solutions for Business Growth
AI & Data Solutions for Business Growth

View more →