

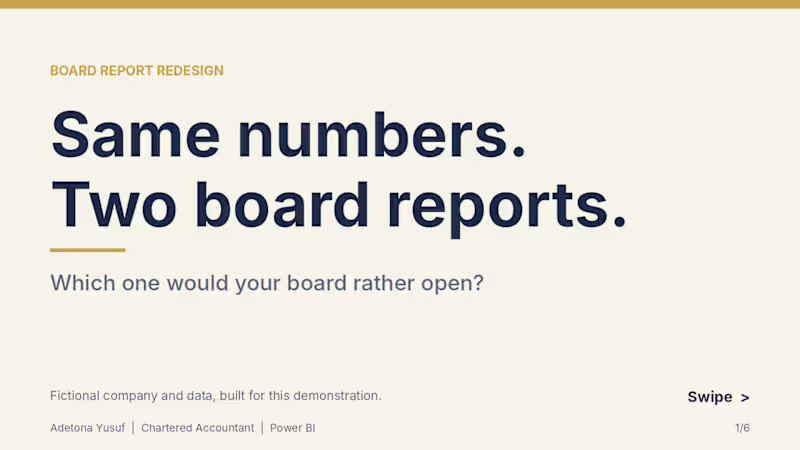
Project title: Board Report Redesign: Q3 Performance Pack (Power BI)
Same financial data, redesigned from a plain Word report into a one-page Power BI board view.
The problem
Board and management reports are often full of accurate numbers that nobody reads closely. Tables, long paragraphs and default charts make people hunt for the headline.
What I did
To show my approach, I built a fictional company’s Q3 board report two ways from the same Excel workbook: a typical plain Word version, and a redesigned one-page Power BI view.
What I changed
• Key figures (revenue, profit, closing cash, variance to budget) placed first
• A waterfall that takes cash from opening balance to closing cash
• Clear chart titles, with units where they apply
• One colour system applied across every visual
• All figures tie back to a single workbook, with DAX measures checked against it
Deliverables in this sample
• Plain “before” report (Word, 8 pages)
• Redesigned Power BI board view (PDF)
• Source workbook structure and a custom navy and gold theme
Note: The company, figures and report are fictional, created only to demonstrate my approach. No real client data is used.
What I can do for you
I design board packs, investor decks and monthly management reports for SMEs and finance teams, in Power BI and Excel. If your reports get skimmed instead of read, message me.
1
0
193
VoxelPath
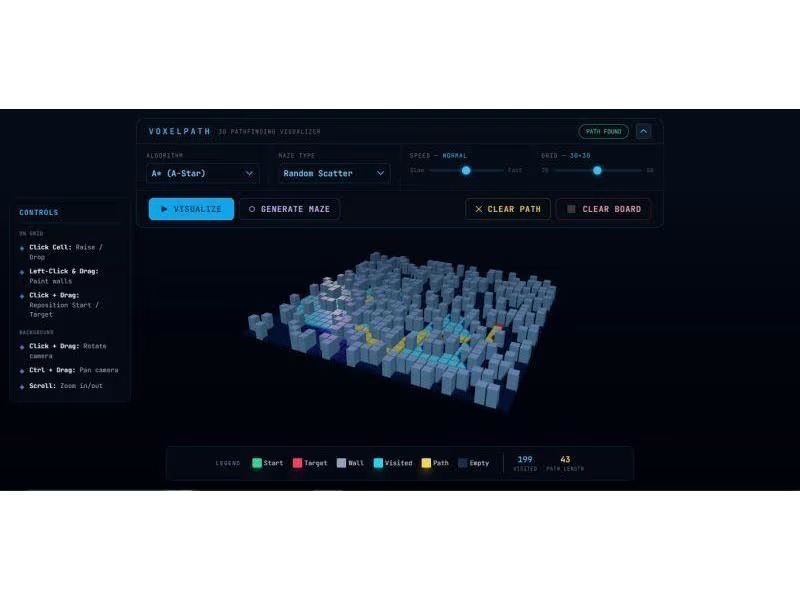
(https://voxelpath.vercel.app/)Ever wondered how Google Maps or game AI actually "thinks" when finding a route?
To figure it out, I built 𝐕𝐨𝐱𝐞𝐥𝐏𝐚𝐭𝐡—an interactive 3D Pathfinding Sandbox.
The goal of this project was to bridge complex algorithmic logic with high-performance 3D rendering. I built a custom engine where users can generate procedural mazes and race algorithms (𝐀*, 𝐃𝐢𝐣𝐤𝐬𝐭𝐫𝐚, 𝐁𝐅𝐒, 𝐃𝐅𝐒) against each other to find the most efficient path.
Click the "VoxelPath" link above to interact with the environment.
1
287



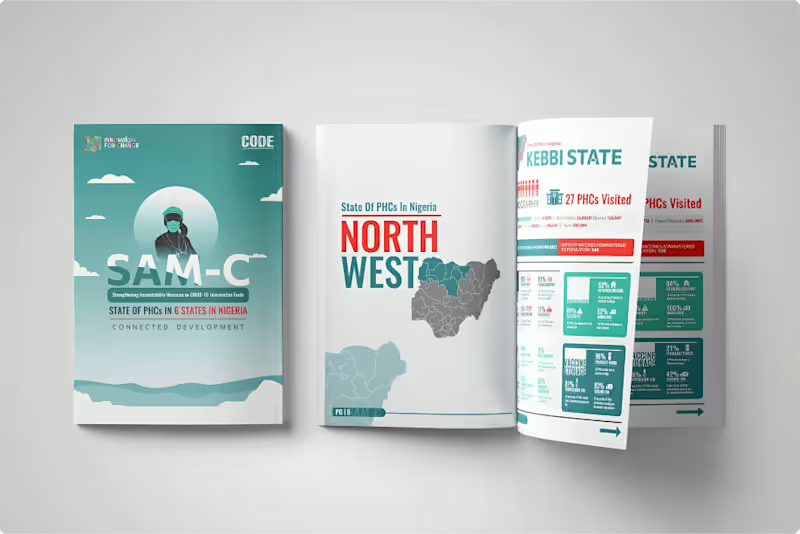
I designed the visual report for the Strengthening Accountability Mechanisms in Primary Health Care (SAM-C) project, spotlighting the state of primary health care across rural communities in South-West and Northern Nigeria.
Our focus was to translate complex field data into clear, human-centered visuals, using infographics, data visualizations, and clean layouts that amplify the findings while keeping the reader engaged.
From community-level insights to policy recommendations, every spread was designed to reflect SAM-C’s mission: improving access, accountability, and quality in Nigeria’s primary health care system.
Design that informs. Design that drives change.
0
105

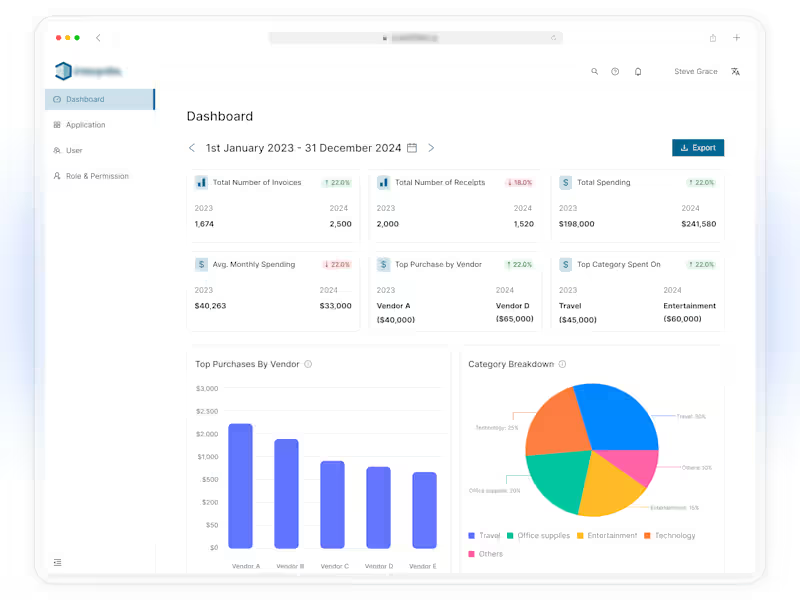

I designed the portfolio feature for a stock tracking app.
The main goal was simple:
Help users understand what they own, how much their portfolio is worth, and how it is performing without making the experience complicated.
The problem
Tracking different stocks can quickly become confusing.
Users may have several holdings, different amounts invested, different returns, and changing stock prices.
The challenge was to bring all of this information into one simple screen.
The solution
I designed the Portfolio screen around the information users need most.
The screen includes:
Portfolio value: shows the current total value of the portfolio.
Performance chart: helps users quickly see how the portfolio has changed over time.
Time filters: users can switch between 1D, 1W, 1M, 6M, YTD, 1Y, and MAX.
Today’s return: shows how the portfolio is performing today.
Total return: shows the overall gain or loss.
Invested amount: shows how much has been invested.
Holdings: gives users a clear list of the stocks in their portfolio.
Sorting: lets users organize holdings by value.
Design approach
I wanted the screen to feel clean, calm, and easy to understand.
Instead of showing too much information at once, I created a clear visual hierarchy:
Portfolio value → Performance → Key numbers → Holdings
This allows users to understand their portfolio at a glance and explore more details when they need them.
Important product decision
This is a stock tracking app, not a trading app.
The portfolio does not hold money, place trades, or give investment advice.
Users manually manage their portfolio so they can use the app to track their holdings and performance.
What I focused on
For this design, I focused on:
Clear information hierarchy
Simple data visualization
Easy-to-scan numbers
Clean spacing and typography
Useful portfolio insights
A simple way to browse holdings
Making complex financial information feel easy
The goal was not to make the screen look complicated.
The goal was to make complex information feel simple.
What do you think about this design?
4
3
283
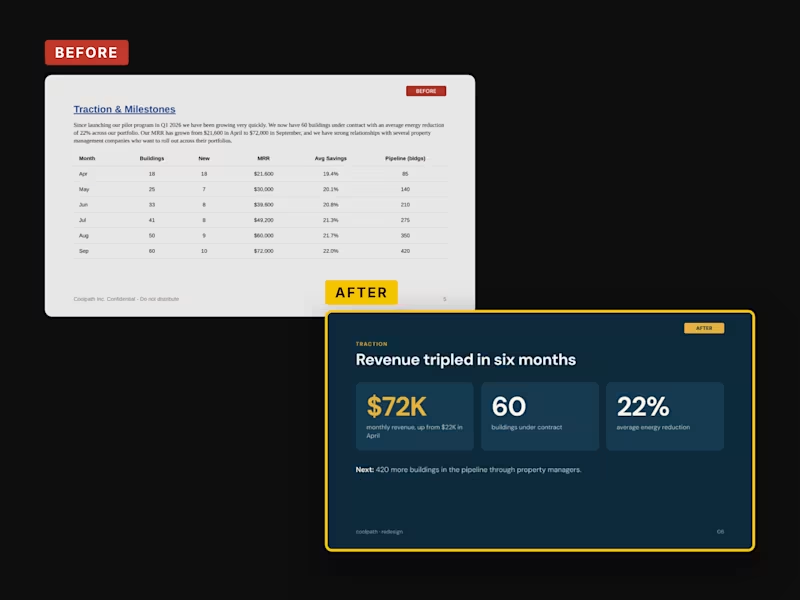
Coolpath: Climate Deck Before & After (Concept)
A before-and-after redesign of three slides from a typical founder draft for a fictional climate tech startup. Same company, same facts. The problem slide went from six bullets to one number. The traction slide’s six-column table became “Revenue tripled in six months.” A $147B TAM was replaced with market math investors can check.
Concept project
0
47