Freelance Systems Engineers in KarachiFreelance Systems Engineers in Karachi
Production-ready AI agents and SaaS built to scale reliably.
$25k+
Earned
2x
Hired
80
Followers
Production-ready AI agents and SaaS built to scale reliably.
Cover image for Project Overview:
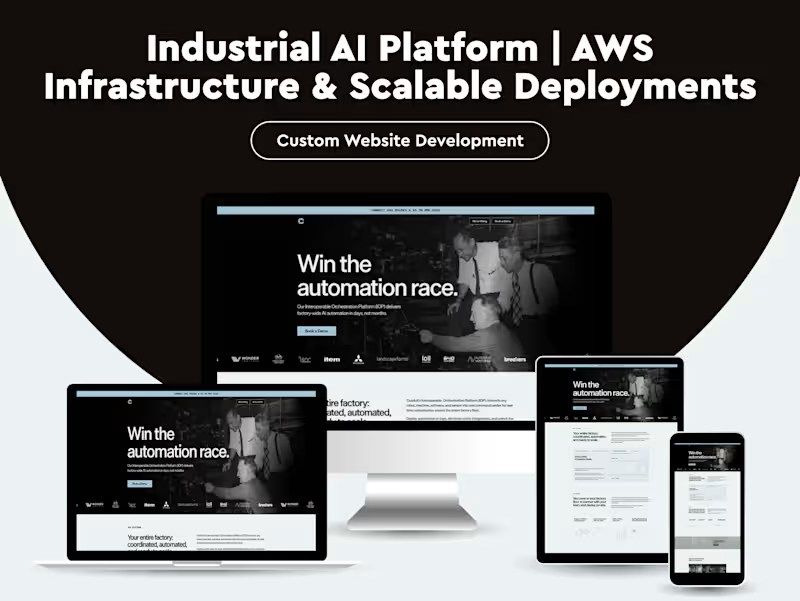
Conduit's Interoperable Orchestration Platform
Project Overview: Conduit's Interoperable Orchestration Platform (IOP) seamlessly connects robots, machines, software, and sensors into a unified command center, enabling real-time factory floor automation and intelligence. It accelerates deployment, reduces integration costs, and transforms operations into fast, resilient, high-output systems. The Challenge Factory automation is often limited by: 1. Fragmented systems: Robots, machines, and sensors operate in silos, complicating coordination. 2. High integration costs: Connecting diverse equipment requires custom, expensive solutions. 3. Lack of real-time insights: Without live data, decision-making is slow, reducing efficiency and output. The Solution Conduit's IOP streamlines factory operations by: 1. Unified orchestration: Connects any robot, machine, software, or sensor into a single command center. 2. Rapid deployment: Automation workflows can be implemented in days, not months. 3. Live factory intelligence: Provides real-time insights to optimize productivity, reduce downtime, and enhance resilience. 4. Landing Page Description Conduit's Interoperable Orchestration Platform (IOP) connects every robot, machine, software, and sensor into a single command center. Deploy automation in days, gain real-time factory insights, and transform your operations into a fast, resilient, high-output powerhouse. What Our Client Got: We delivered a fully functional Conduit IOP with: - A unified command center connecting all robots, machines, software, and sensors. - Rapid deployment tools for automation workflows in days. - Real-time dashboards and analytics for actionable factory insights. Results Achieved: - 70% faster automation deployment across the factory floor. - 60% reduction in costly system integrations. - 85% improvement in operational efficiency and uptime. Conduit IOP is now transforming factories into high-output, resilient, and intelligent operations.
1
1.1K
Cover image for From Instinct to Infrastructure: How
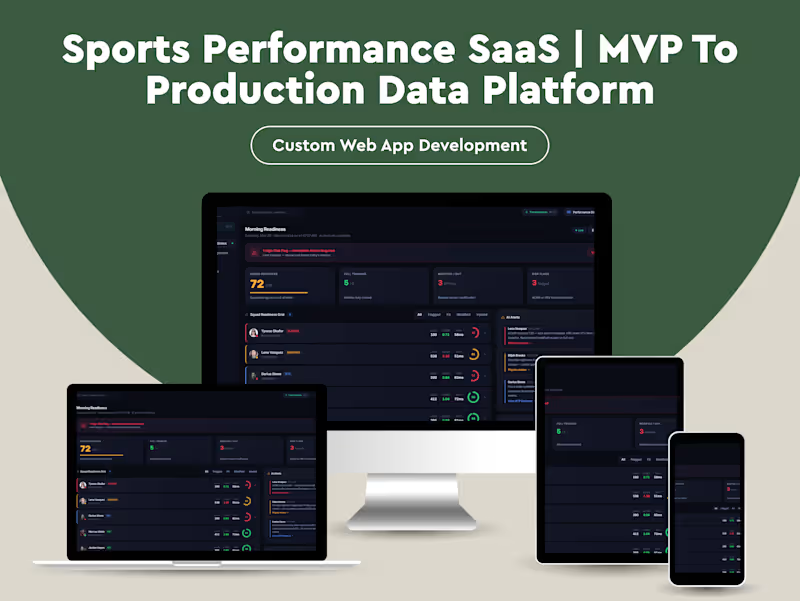
From Instinct to Infrastructure: How Athliq Went From Trainer's Notebook to Production Performance Platform ────────────────────────────────────────── The Person Who Understood the Problem Before Anyone Else Did Marcus had been a strength and conditioning coach for eleven years. He'd worked with professional football squads, Olympic track athletes, and NCAA programs. He knew exactly what was wrong with how performance data was managed, not because someone told him, but because he'd lived inside the problem every day. Every morning, he'd open four browser tabs, a spreadsheet, and a WhatsApp thread just to answer one question: Is this athlete safe to train today? HRV from one app. Sleep data from another. Yesterday's load from a Google Sheet. Wellness check-ins in a form nobody filled out consistently. Injury notes in a physio's personal folder. The picture was always incomplete, not because the data didn't exist, but because no system was designed to assemble it. He wasn't guessing the problem. He was the problem's daily victim. So he built something. ────────────────────────────────────────── The First Version Had Real Value What Marcus and a developer friend put together in six weeks was genuinely useful. A React frontend. Static JSON files simulating the data feeds he wished he had. A morning readiness dashboard showing each athlete's status: green, amber, red. ACWR calculations. A training plan view. A return-to-play protocol tracker. It looked like a real platform. It felt like one. When he demoed it to his performance director, the response was immediate: "This is what we've been trying to build for two years." The prototype surfaced something important. The problem wasn't that nobody had the data. The problem was nobody had designed the right lens to look at it through. Marcus had. His system organized information around the questions coaches actually ask, not the questions software vendors assume they ask. The initial build worked. For one squad. In static conditions. With fake data. And that was exactly the point where it started to matter, and exactly the point where its limitations became unavoidable. ────────────────────────────────────────── What Started Breaking The prototype had no backend. Data was hardcoded. Every "insight" was pre-written. The readiness scores didn't calculate; they were authored. When a second sport scientist saw the demo and said, "Can we plug in our GPS data?" there was no honest answer that didn't involve a complete rebuild. More specifically: The data layer was decorative. The JSON files looked real but required manual authoring for every scenario. There was no pipeline, no ingestion, no validation. Any live deployment would mean the dashboard showed stale or fabricated numbers, which in a performance context is worse than showing nothing at all. The AI insights were static strings. Every "AI-generated" recommendation was hardcoded text. In the prototype, this was fine. It demonstrated the concept. In production, it would mean the same insight appearing for every athlete regardless of their actual state, silently eroding clinician trust. The system had no concept of time. Training load calculations, ACWR ratios, wellness trends, all of these are temporal by definition. The prototype rendered them as snapshots. A real system needed rolling windows, historical comparison, and the ability to detect change over time. There was no role isolation. The role switcher in the UI was cosmetic. A physio and a performance director seeing the same underlying data with a CSS class change was not access control, it was theater. Nothing would survive a real integration. Real wearables return messy, incomplete, delayed data. The system had no error handling, no retry logic, no fallback states. The first real data feed would have broken the UI in ways that were invisible until they were catastrophic. The system was not wrong. It was early. ────────────────────────────────────────── Why They Didn't Just Fix It Themselves Marcus understood sport science. His developer understood React. Neither of them had built a production data system before, and that gap is not a skills deficiency, it is a domain specialization. What they needed was not someone to rewrite their frontend. The frontend was actually good. The visual hierarchy was sharp, the domain terminology was accurate, the workflows reflected how coaches genuinely think. That institutional knowledge was irreplaceable and not to be discarded. What they needed was: β€’ A real-time data layer that could ingest from multiple sources reliably β€’ A calculation engine that could run ACWR, load zone distributions, and readiness scoring against live data β€’ A structured API contract between the front and back end β€’ Authentication and role-based data scoping that actually enforced access boundaries β€’ Observability, so when something silently broke, someone would know The prototype had proven the concept. The job now was to make the concept dependable. ────────────────────────────────────────── What We Actually Did We kept the frontend. Almost entirely. The visual design, the component architecture, the domain-accurate terminology, all of it stayed. We refactored the data layer, not the UI layer. The prototype's greatest strength was its UX fidelity to how coaches actually work, and we had no interest in rebuilding that from scratch. We built a real data ingestion pipeline. Rather than static JSON, we designed a service layer that could ingest from GPS units, HRV monitors, and wellness form submissions. Each source had its own adapter with validation, normalization, and error handling. Partial data was acceptable; silently wrong data was not. We replaced static calculations with a live computation engine. ACWR calculations now ran against a rolling 28-day window of actual load data. Readiness scoring pulled from real HRV baselines, not fixed numbers, and recalibrated as an athlete's personal baseline shifted over a training block. We replaced pre-written AI insights with a rules-based inference layer. Every insight shown in the platform now corresponded to a condition that was evaluated against live data. If Lena Vasquez's ACWR crossed 1.3 and her HRV dropped more than 15% from her 7-day baseline, the injury risk flag was triggered, not because it was hardcoded, but because those conditions were true. We implemented real role-based access control. A physio sees medical data, injury history, and RTP protocols. A sport scientist sees load analytics and benchmarks. A performance director sees the squad-level overview. A head coach sees readiness and today's session. The frontend already had role-switching built in, we gave it actual enforcement. We added observability throughout. Every data ingestion event was logged. Every calculation that produced an out-of-range result generated an alert. If a data source stopped sending, the system surfaced a staleness warning rather than silently displaying old numbers as current. ────────────────────────────────────────── Tech Stack React 19 + Vite, Tailwind CSS v3, Recharts, React Router v7, Node.js + Fastify, PostgreSQL + TimescaleDB, Redis, GPS/HRV/sleep data adapters (Catapult, Polar, Garmin), Google Forms/Typeform ingestion, Auth0, row-level security, Sentry, Datadog, Railway/Render, Vercel, Supabase Storage What Changed The morning workflow Marcus had been running across four tabs and a spreadsheet now ran in a single view that was populated automatically before he arrived at the training ground. The difference wasn't just convenience. It was confidence. When the dashboard flagged an athlete as high-risk, the coaching staff could interrogate why and trust the answer. When a return-to-play progression showed 80% completion, that number reflected actual criteria met against measured data, not a manually updated percentage. The platform was no longer a demo tool. It was a clinical decision-support system. For the squads using it, the shift was measurable: fewer reactive injury responses, more consistent load monitoring, and perhaps most importantly, a shared language between coaching staff, physios, and sport scientists built around the same data rather than competing interpretations of separate sources. ────────────────────────────────────────── The Part That Rarely Gets Said Most platforms built in this space start from the software side. Someone builds a data collection tool, adds a dashboard, and then tries to reverse-engineer what coaches actually care about. Athliq started from the other direction. A domain expert who understood the problem at a professional level built the frame first, and built it correctly. The pain points were real, the workflows were accurate, the terminology was precise. The engineering work didn't fix a bad idea. It made a good idea survivable. That distinction matters more than most technical case studies acknowledge. The hardest part of building a platform like this is not the infrastructure. It's knowing which questions to answer. That knowledge was already there. Our job was to make sure the system could keep answering them reliably, at scale, over time. ────────────────────────────────────────── Athliq is now in active deployment across two professional squads and one university performance program. The morning readiness dashboard processes real-time data from four integrated sources and serves role-scoped views to performance directors, sport scientists, physiotherapists, and athletes.
1
2
1.5K
Cover image for KovaRisk: When the Interface Knew
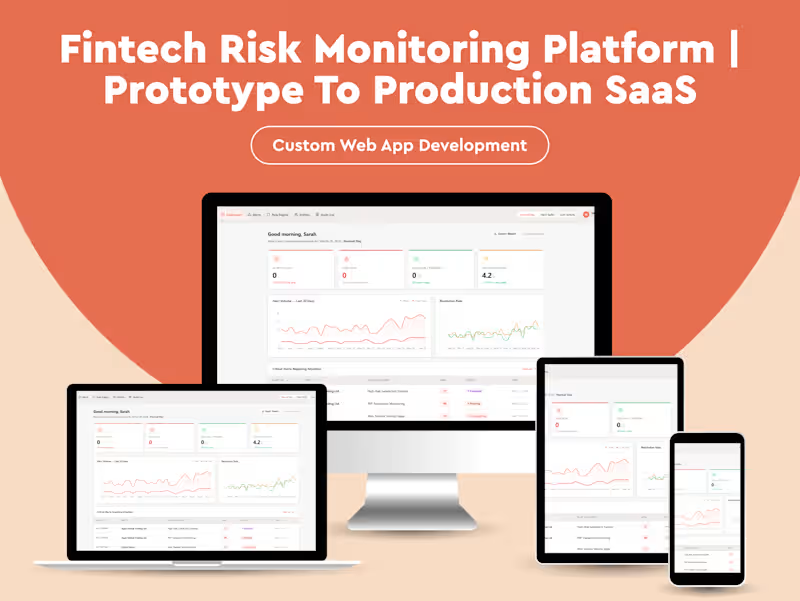
KovaRisk: When the Interface Knew More Than the System ────────────────────────────────────────── The Expert in the Room Compliance officers don't struggle to understand risk. They struggle to act on it fast enough. The team behind KovaRisk understood this precisely. They had spent years inside financial institutions watching the same dysfunction repeat: alerts buried in spreadsheets, investigations tracked in email threads, audit trails reconstructed after the fact. They knew what the interface needed to feel like because they'd lived with the one that didn't. So they built it. Fast. Exactly as they'd imagined it. What emerged was sharp: a risk monitoring dashboard with filterable alert feeds, entity profiles with 12-month risk trajectories, a rule engine with toggle controls, and an audit log that felt immutable. The scenario switcher let compliance teams stress-test different alert load states. The side panel made investigations feel contained and intentional. It looked like a system that had survived production. It hadn't been asked to yet. ────────────────────────────────────────── What Existed Was a Strong Interface - Not a System Every alert in KovaRisk was generated at startup. Every risk score was computed by a random seed function. Every status change - Investigating, Resolved, Escalated - lived in component state. Every timeline event was appended to an in-memory array. Every rule toggle disappeared on refresh. The audit log recorded nothing. The export downloaded a snapshot of what React was holding at that moment. The entity risk history was a curve drawn from a formula, not a record. The logic was there. But it had nowhere to live. A compliance officer investigating a high-risk wire transfer would open the side panel, read the plain-English rule explanation, mark the alert as Investigating, add an internal note - and lose every one of those actions the moment they refreshed the browser. No colleague could see what they'd done. No regulator could verify it had happened. In financial compliance, that's not a UX problem. It's a liability. The prototype validated the workflow brilliantly. It exposed exactly how a compliance team would move through their day. But three things were missing: a source of truth, a coordination layer, and a trail that could be audited under pressure. ────────────────────────────────────────── They Didn't Need More Features - They Needed a System Behind the Interface The team came with a clear idea and a working prototype. What they needed was the architecture that made the prototype a product - the layer that turned interface actions into durable facts. Not a rebuild. A foundation. ────────────────────────────────────────── The Layer That Made It Dependable Data Models: Giving State a Home The first thing to reconstruct was where the data should actually live. KovaRisk's frontend implied a clear schema - alerts, entities, rules, audit events - but none of it persisted. The production system needed a PostgreSQL core with five primary entities: β€’ Alert β€” with foreign keys to Entity, Rule, Transaction, and a JSONB timeline column for ordered event history β€’ Entity β€” with risk tier, jurisdiction metadata, and a one-to-many relationship to RiskScore snapshots β€’ Rule β€” with active/disabled state, trigger thresholds, false-positive tracking, and a versioning mechanism so changes to rules didn't retroactively alter historical alerts β€’ AuditEvent β€” append-only, with actor ID, action type, target reference, and a server-generated timestamp that clients cannot modify β€’ InternalNote β€” owned by an alert, with authorship and a soft-delete flag to preserve compliance integrity Every status change, note, escalation, and flag the UI handled ephemerally became a write to this schema. The Alert Generation Engine: Replacing the Seed Function In the prototype, 85 alerts appeared because a loop ran 85 times at startup. In production, alerts are the output of a Transaction Monitoring Service - a background process that runs continuously against incoming transaction streams. This service: β€’ Evaluates each transaction against every active Rule definition β€’ Computes a risk score using rule weights, entity risk tier, jurisdiction flags, and behavioral baselines β€’ Creates an Alert record only when a threshold is breached β€’ Emits an event to a notification queue for high-risk triggers The rule engine the UI let users toggle wasn't decorative. Each rule mapped to an evaluation function in the monitoring service. Disabling a rule didn't just grey out a card - it removed it from the active evaluation set. Re-enabling it didn't retroactively generate alerts it would have caught; it resumed from the point of activation. That distinction mattered for regulatory defensibility. ────────────────────────────────────────── Async Workflows: The Operations the UI Implied But Couldn't Sustain Several interactions in the prototype implied workflows that couldn't complete synchronously. Escalation - When an alert was escalated, the UI changed a status badge. In production, escalation triggers a queue job that: notifies the senior compliance officer via a configured channel, creates a case record linking the alert, and starts a response SLA timer. The UI reflects the outcome - it doesn't produce it. Scheduled Screening - The Sanctions Screening Match rule in the prototype was static. In production, it's a nightly job that re-screens all active entities against updated OFAC, EU, and UN sanctions lists - generating new alerts if a previously clean entity now appears. The results feed back into the alert pipeline. Report Export - The dashboard's Export Report button downloaded a text file of whatever React was holding in memory. In production, report generation is an async job: the user requests the report, the job runs server-side against the live database, and a download link is returned when ready. The content is a verifiable, timestamped record - not a UI snapshot. ────────────────────────────────────────── The Audit Log: From Feed to Fact The prototype's audit log was populated by a generateAuditLog function. It looked comprehensive and immutable. It was neither. Production audit events are written by the API layer on every state-modifying operation - before the response is returned to the client. The table is append-only. No update operations are permitted on AuditEvent records. Timestamps are server-generated in UTC and stored with full precision. Actor identity comes from the authenticated session, not from a string the client sends. The audit log the interface displayed was a simulation of accountability. The production version is the accountability. ────────────────────────────────────────── Tech Stack 1. Frontend: React + Vite, React Router v6, Recharts, React Context + local state, TanStack Query 2. Backend: Node.js + TypeScript, Fastify, Prisma, PostgreSQL, Redis, BullMQ, Passport.js + express-session 3. Infrastructure: AWS ECS / Railway / Render, S3, AWS Secrets Manager / Doppler, Sentry + Datadog, GitHub Actions 4. External Integrations: OFAC / ComplyAdvantage, Refinitiv World-Check, SendGrid / SMTP, WebhooksΒ  ────────────────────────────────────────── From Interface to System The prototype answered the right questions. It proved the workflow was sound, the information hierarchy was correct, and the alert investigation pattern worked the way compliance officers needed it to. What it couldn't answer was: what happens when two investigators open the same alert simultaneously? What happens when a rule change needs to take effect immediately across 200 pending alerts? What happens when a regulator asks for every action taken on a specific entity over the past 18 months? Those questions don't live in the interface. They live in the system. KovaRisk's interface was always strong. What it needed was the architecture to make it real - persistent, coordinated, auditable, and defensible under scrutiny. The logic existed from the beginning. We gave it somewhere to live.
1
1.4K
Full-Stack Developer & Digital Consultant
5.0
Rating
4
Followers
Full-Stack Developer & Digital Consultant
Cybersecurity engineer and software developer building robus
New to Contra
Cybersecurity engineer and software developer building robus
Cover image for Vexis is a custom x86-64
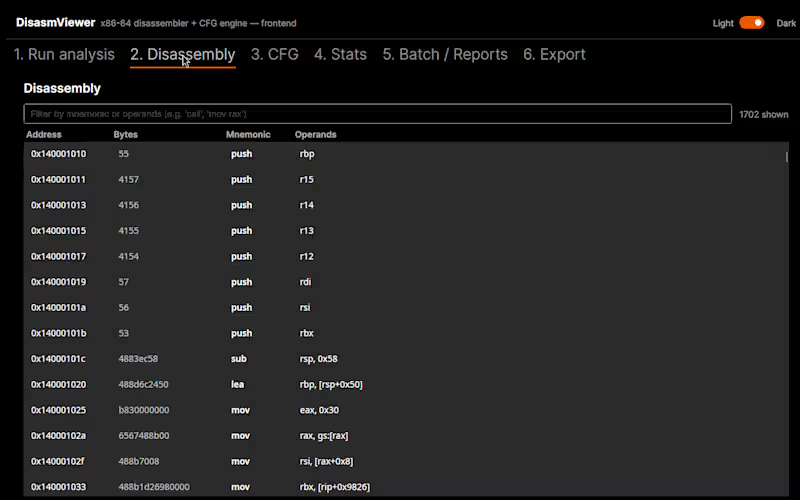
Vexis is a custom x86-64 binary analysis and reverse-engineering platform I built from the ground up in Rust, with a .NET desktop frontend for interactive analysis. Instead of wrapping an existing disassembly library, I implemented the core instruction-decoding pipeline myself, including legacy and REX prefixes, ModR/M, SIB addressing, RIP-relative addressing, instruction boundaries, and control-flow instructions. From that decoded instruction stream, Vexis reconstructs basic blocks, functions, and typed control-flow graphs, calculates cyclomatic complexity, identifies anti-disassembly patterns, and generates structured analysis reports. The visual frontend turns the analysis engine into a usable product: users can inspect full disassembly, explore function-level CFGs, review complexity and control-flow statistics, and analyze entire batches of binaries from one interface. Key engineering work included: Custom x86-64 instruction decoder written in Rust Linear-sweep and recursive-descent analysis strategies Basic-block and function recovery Control-flow graph generation and visualization Cyclomatic complexity and binary statistics Anti-disassembly detection Batch analysis across multiple binaries JSON, Markdown, and Graphviz reporting Differential testing and fuzz testing of the decoder .NET GUI communicating with the Rust engine across a clean process boundary The result is more than a frontend demo: it is a complete analysis pipeline that goes from raw PE64 machine code to searchable disassembly, recovered program structure, visual control flow, and automated reports.
0
42
Cover image for ShadowForge is an adversary-emulation and
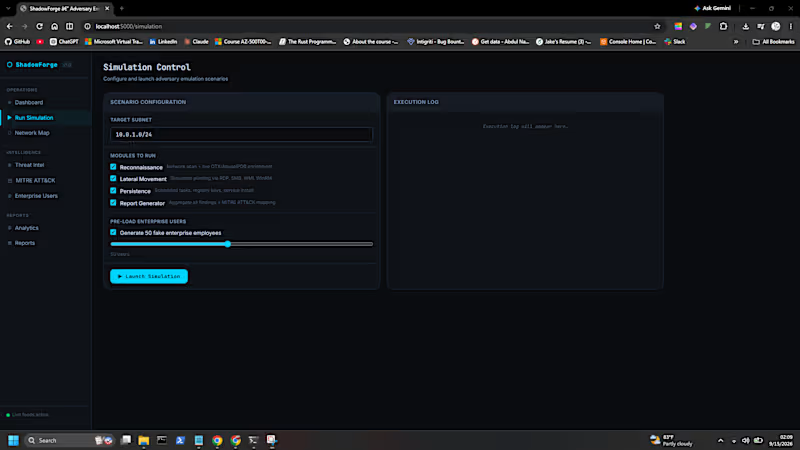
ShadowForge is an adversary-emulation and security-validation platform I built to help security teams model attack scenarios, visualize activity, correlate threat intelligence, and evaluate defensive visibility from a single operations interface. The platform brings together scenario orchestration, network visualization, threat intelligence, MITRE ATT&CK mapping, enterprise identity simulation, analytics, and reporting into one unified workflow. I designed the application around modular simulation components so authorized lab and security-validation exercises can be configured, observed, and translated into useful defensive findings rather than scattered logs and manual notes. Key engineering work included: Centralized security operations dashboard Configurable adversary-emulation scenarios Reconnaissance and environment-discovery simulation Lateral-movement and persistence scenario modeling Live execution-event visualization Network topology and host mapping MITRE ATT&CK technique mapping Threat-intelligence and IOC enrichment Enterprise user simulation for realistic lab scenarios Security analytics and severity tracking Automated findings and report generation Modular architecture designed for controlled security testing ShadowForge turns an authorized security exercise into something measurable: operators can configure a scenario, observe activity as it happens, correlate findings with threat intelligence and ATT&CK techniques, and produce structured results for defensive analysis. Built for controlled labs, security validation, and authorized adversary-emulation environments.
0
53
Transforming Ideas to working Solutions