Freelance Data Modelling Analysts in Karachi
Sign Up
Post a job
Sign Up
Log In
Filters
2
Projects
People
Darakhshan Zahid
Karachi, Pakistan
Dashboard & Data Analytics Expert
New to Contra
Follow
Message
Dashboard & Data Analytics Expert
0
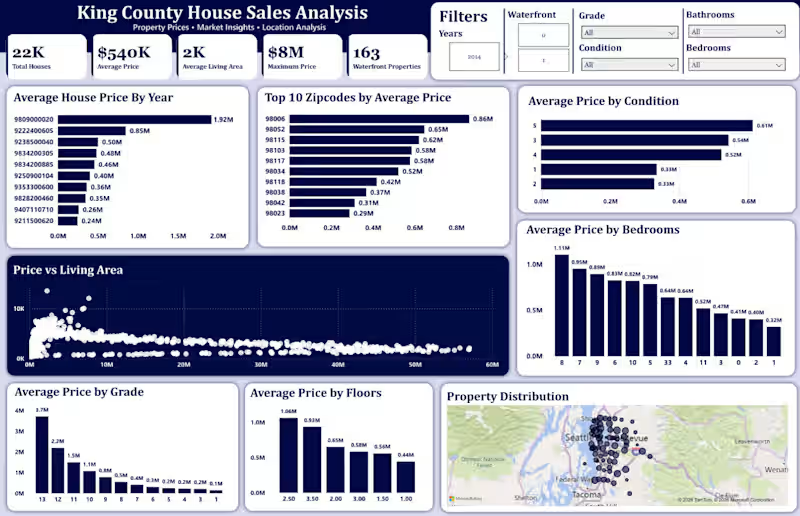
Finally wrapped up the Power BI dashboard for my House Sales Analysis project π π After cleaning and exploring the data with Python and writing SQL queries, I used Power BI to turn the analysis into an interactive dashboard. In the dashboard, I explored: House price trends Property size and pricing House grades Waterfront vs non-waterfront properties Location-wise pricing Bedrooms and other property features I also worked with DAX measures, slicers, interactive visuals, and KPIs to make the dashboard more useful for exploring the data. This project helped me practice the complete data analytics workflow: Python β Data Cleaning & EDA β SQL β Power BI Still learning and improving with every project. π #PowerBI #DataAnalyst #DataAnalytics #SQL #Python #EDA #DataCleaning #DAX #BusinessIntelligence #DataVisualization #PowerBIDashboard #PortfolioProject #DataAnalysis
0
9
0
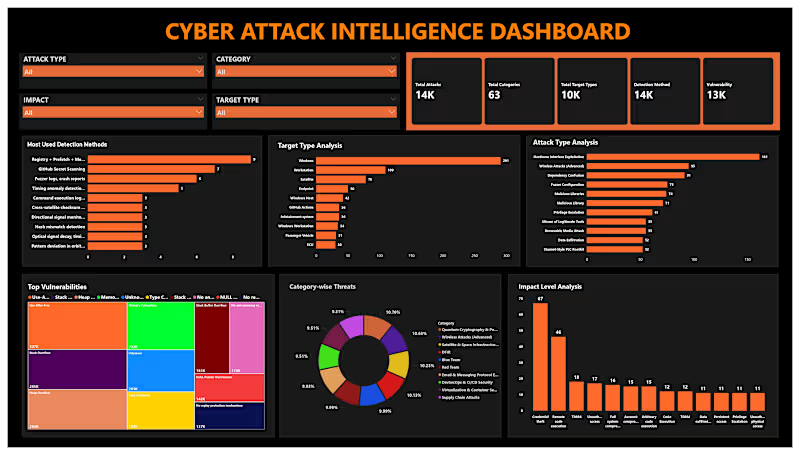
Cyber Security Analytics Dashboard ππ Cybersecurity is more than detecting threatsβit's about turning security data into actionable insights. In this Power BI dashboard, I analyzed cybersecurity data to monitor security incidents, attack patterns, threat severity, affected systems, and overall security KPIs. The interactive dashboard helps organizations identify risks, improve monitoring, and support faster, data-driven security decisions. Tools Used: Power BI SQL Python (Data Cleaning & Analysis) Key Skills: Cyber Security Analytics | Threat Analysis | Security Dashboard | Risk Analysis | Incident Monitoring | Data Visualization | Business Intelligence | SQL | Python | Power BI | Data Analytics #PowerBI #CyberSecurity #CyberSecurityAnalytics #ThreatIntelligence #DataAnalytics #BusinessIntelligence #DashboardDesign #SQL #Python #DataVisualization #DataAnalyst #PortfolioProject #SecurityAnalytics
0
37
0
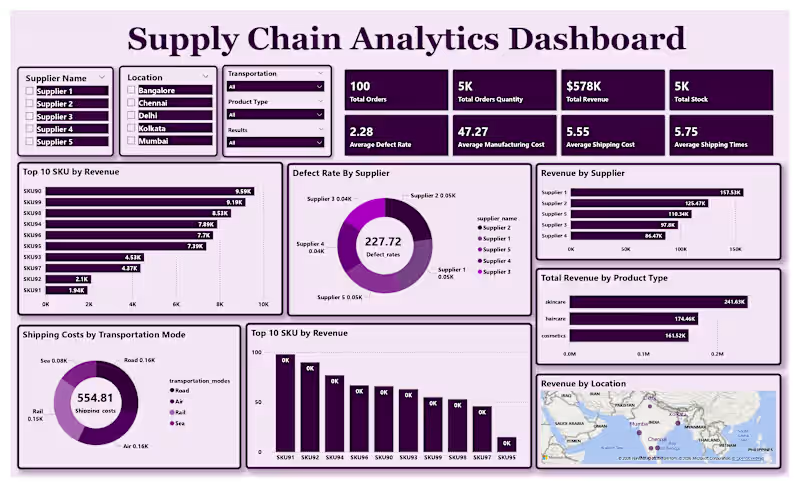
Supply Chain Performance Dashboard π¦π Efficient supply chains drive better business outcomes. This dashboard transforms operational data into actionable insights for inventory, logistics, and fulfillment performance. Using Power BI, I analyzed key supply chain metrics such as order status, inventory levels, shipping performance, supplier efficiency, delivery timelines, and overall operational KPIs. The interactive dashboard helps identify bottlenecks, optimize inventory, and support data-driven decision-making. Tools Used: Power BI SQL Python (Data Cleaning & Analysis) Key Skills: Supply Chain Analytics | Inventory Analysis | Logistics Analytics | KPI Dashboard | Business Intelligence | Data Visualization | Data Cleaning | SQL | Power BI | Python | Business Analytics #PowerBI #SupplyChain #SupplyChainAnalytics #Logistics #InventoryManagement #BusinessIntelligence #DataAnalytics #DashboardDesign #SQL #Python #DataVisualization #BusinessAnalytics #PortfolioProject #DataAnalyst
0
39
0
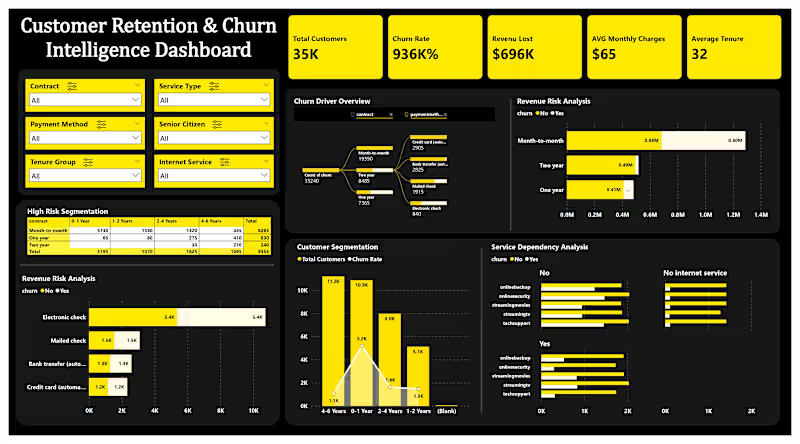
Telecom Customer Churn Analysis Dashboard π Understanding why customers leave is essential for improving retention and business growth. In this Power BI dashboard, I analyzed a telecom customer churn dataset to identify key churn drivers, customer demographics, contract types, monthly charges, payment methods, and tenure patterns. The dashboard provides interactive KPIs and visual insights that help businesses make data-driven decisions to reduce customer churn. Tools Used: β’ Power BI β’ SQL β’ Python (Data Cleaning & Analysis) Key Skills: Customer Churn Analysis | Data Cleaning | Data Visualization | KPI Dashboard | Business Intelligence | Interactive Reports | Data Analytics | Business Insights #PowerBI #DataAnalytics #BusinessIntelligence #CustomerChurn #DashboardDesign #SQL #Python #DataVisualization #BusinessAnalytics #DataAnalyst #PortfolioProject #DataDrivenDecisionMaking
0
41
Data Modelling Analyst
(2)
Follow
Message
Maaz Ahmad
Karachi, Pakistan
Data Scientist providing actionable insights
Follow
Message
Data Scientist providing actionable insights
0
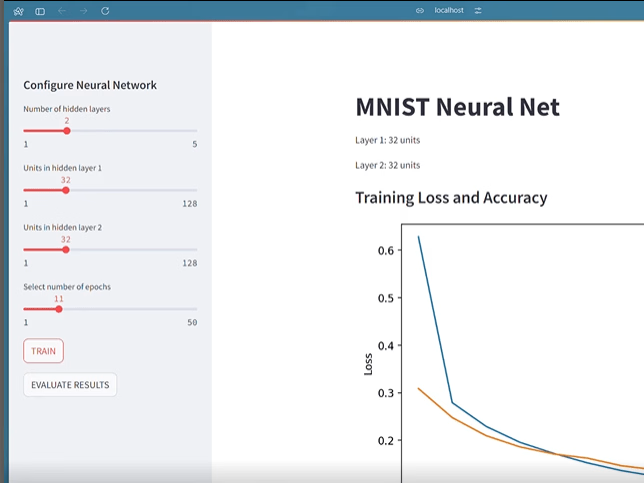
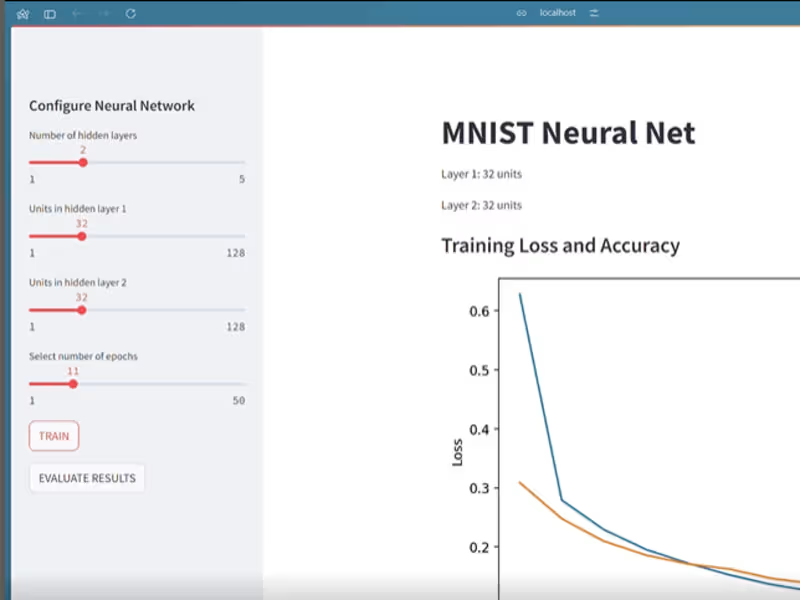
Neural Network Testing App
0
3
0
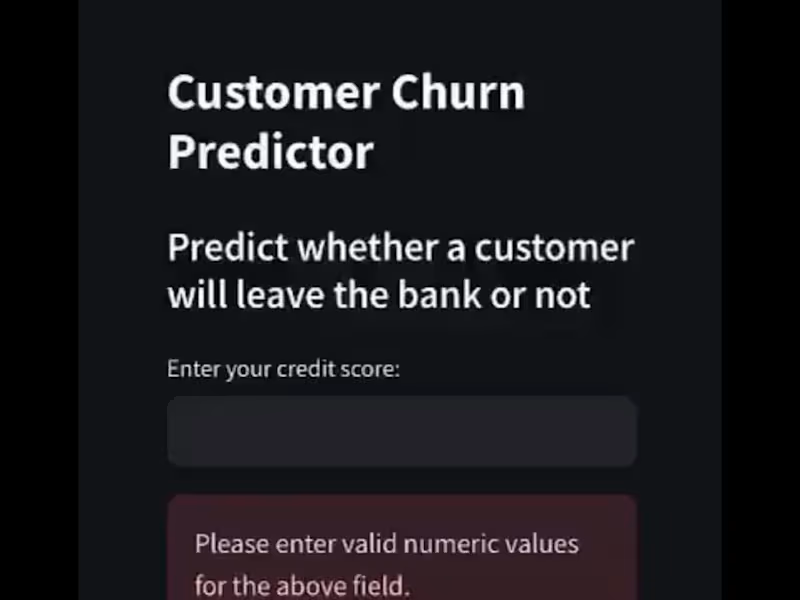
Customer Churn Predictor Web App
0
1
0
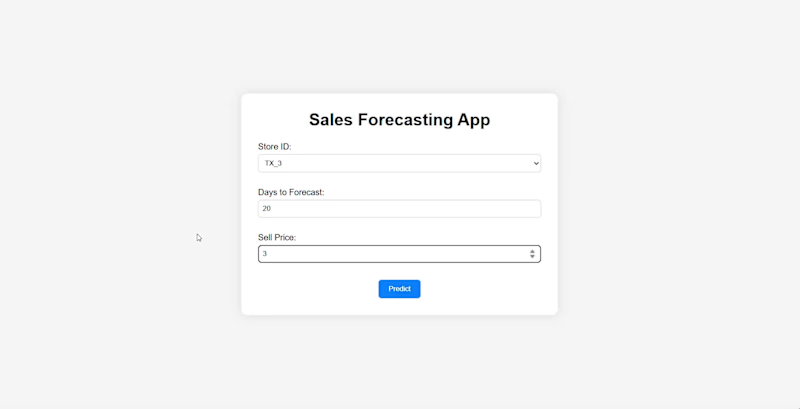
Sales Forecasting Web App Development
0
1
View more β
Data Modelling Analyst
(2)
Follow
Message
Muhammad Umer Rasheed
Karachi, Pakistan
Transforming complex data into clear, strategic insights.
Follow
Message
Transforming complex data into clear, strategic insights.
0
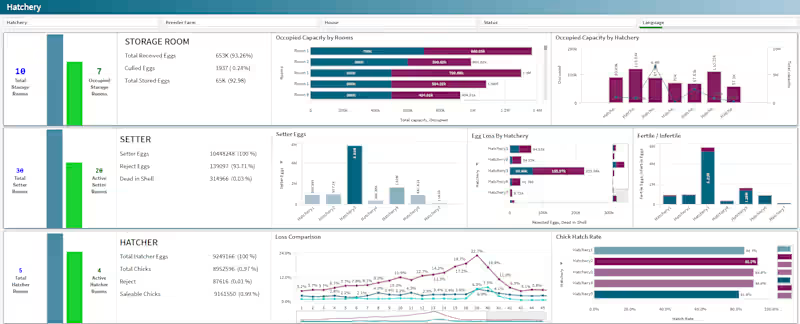
Hatchery Management Dashboard Development
0
4
0
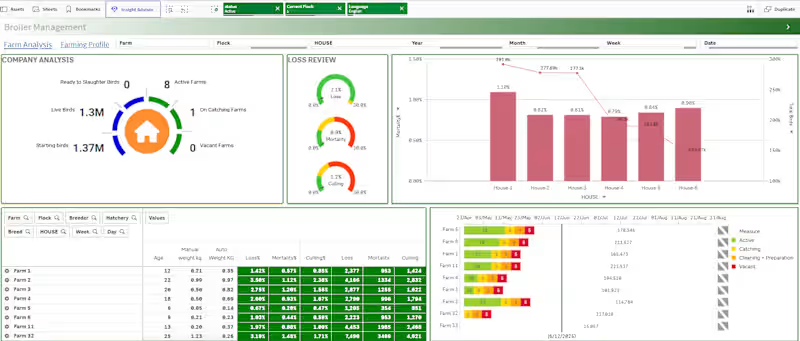
Broiler Management Dashboard Development
0
5
0
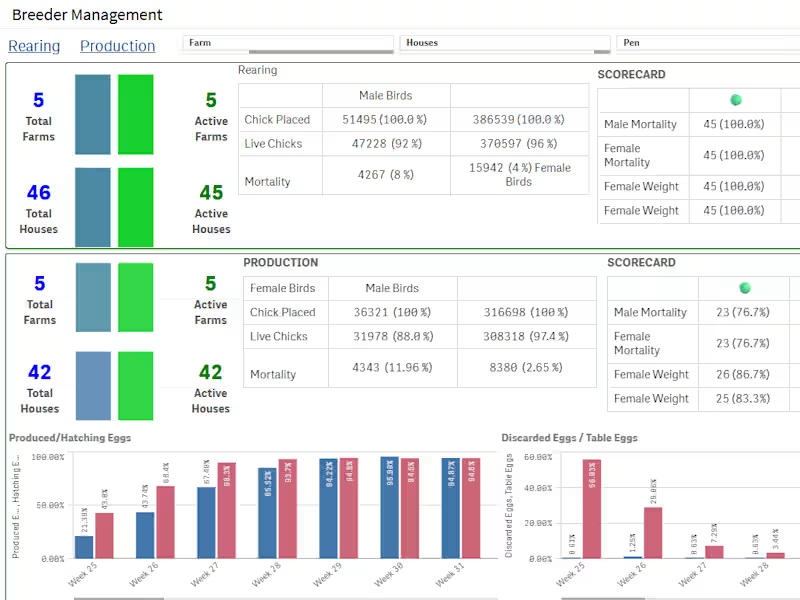
Breeder Farm Performance Dashboard
0
6
View more β
Data Modelling Analyst
(3)
Follow
Message
Tabish Khan
Karachi, Pakistan
I fix warehouse chaos SOPs, SAP & Excel system for ops team
5.0
Rating
8
Followers
Follow
Message
I fix warehouse chaos SOPs, SAP & Excel system for ops team
0
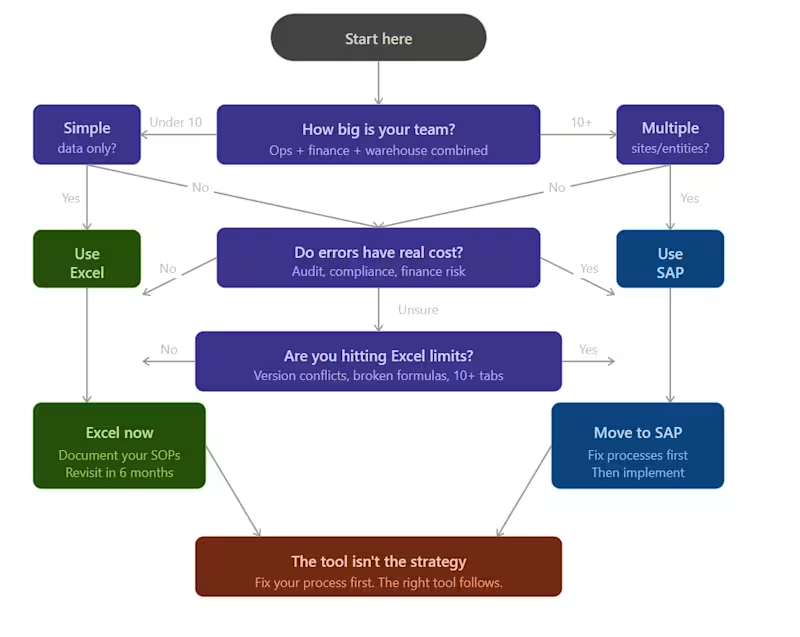
Stop defending Excel. It's costing you more than SAP ever would. I've seen it too many times. A warehouse running 3 locations off a shared spreadsheet. 4 versions of the same file. Nobody knows which one is real. That's not a tool problem. That's a liability. SAP isn't for everyone β but if your Excel sheet has more than 10 tabs and 3 people editing it, you've already outgrown it. Here's the honest breakdown: Excel is fine until: β Two people overwrite each other's data β A formula breaks and nobody notices for 3 weeks β Your auditor asks for a trail and you have nothing SAP makes sense when: β Your ops span multiple sites or entities β Finance, procurement, and warehouse need the same data β Mistakes have a real cost The question isn't which is better. It's which one matches where you actually are. Which one are you using β and are you being honest about whether it's still working?
0
80
0
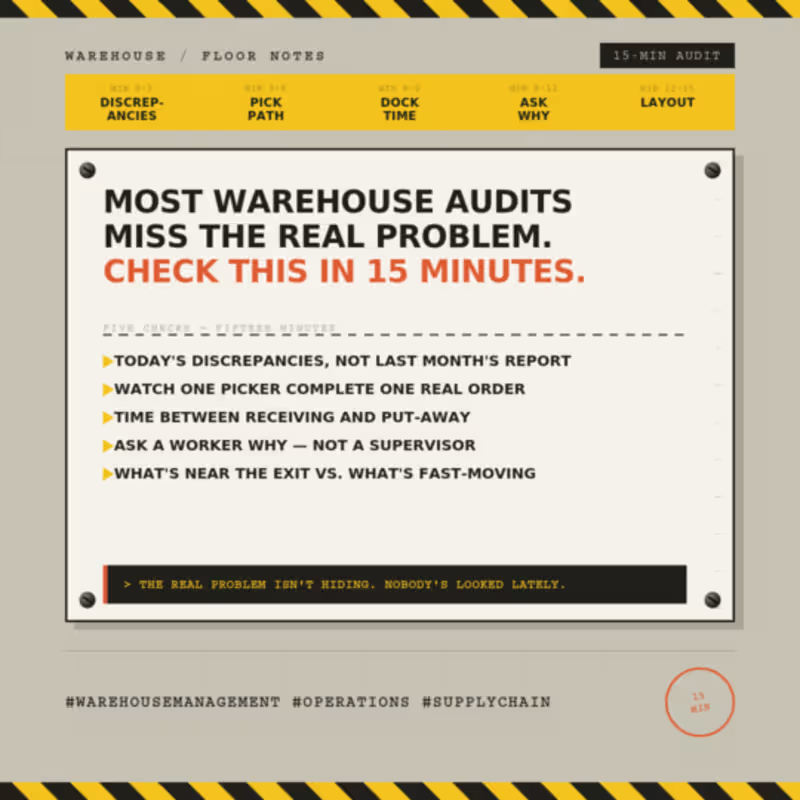
Most warehouse audits I've seen focus on the wrong things first. Neat labels, clean floors, a binder full of SOPs nobody's opened in months β all of it can look great and still sit on top of a warehouse that's quietly bleeding money. And the SOP binder is usually worse than just outdated. Somewhere along the way, the actual process changed β someone found a faster way to do something, or worked around a problem β and that change lived in their head, not in the document. Everyone just adapts and moves on. Then that person leaves, and suddenly nobody can explain why the process works the way it does, because the only place it was ever really "written down" walked out the door. If I only had fifteen minutes to walk a warehouse, here's honestly what I'd check. I'd skip the month-end accuracy report and ask what's mismatched right now, today. A clean number at month-end really just tells you how good someone is at patching things up before a deadline. Asking about today tells you whether the process actually holds up when nobody's paying special attention to it. Then I'd go find one picker and just watch them complete one real order, start to finish β not a demo, an actual order in the middle of a shift. You learn more in five minutes of watching someone walk a pick path than you do in an hour of reading reports. How far they're walking, how often they double back, how many times they have to stop and ask someone where something actually is. I'd also want to know how long stock sits between receiving and put-away. Not how fast it gets scanned in β how long it physically sits on the dock before it's properly stored. That gap, more than almost anything else, is where damage, shrinkage, and "we can't find it" problems quietly start. And I'd ask a warehouse worker why something's done a certain way β not a supervisor. If the answer is "that's just how we've always done it," that's usually a process nobody's questioned in years, or worse, a workaround that only exists in that one person's head. Last thing, I'd look at what's actually sitting near the exit versus what's actually fast-moving. Layouts get set once and almost never revisited. More often than you'd think, the stuff people grab constantly is buried in the back, and something nobody's touched in months is sitting right up front for reasons nobody remembers anymore. None of this needs a clipboard or a formal audit template. It just needs fifteen minutes and being willing to ask "why" one more time than feels comfortable β because the answer might only exist in one person's head, and that's the real audit finding.
0
37
0
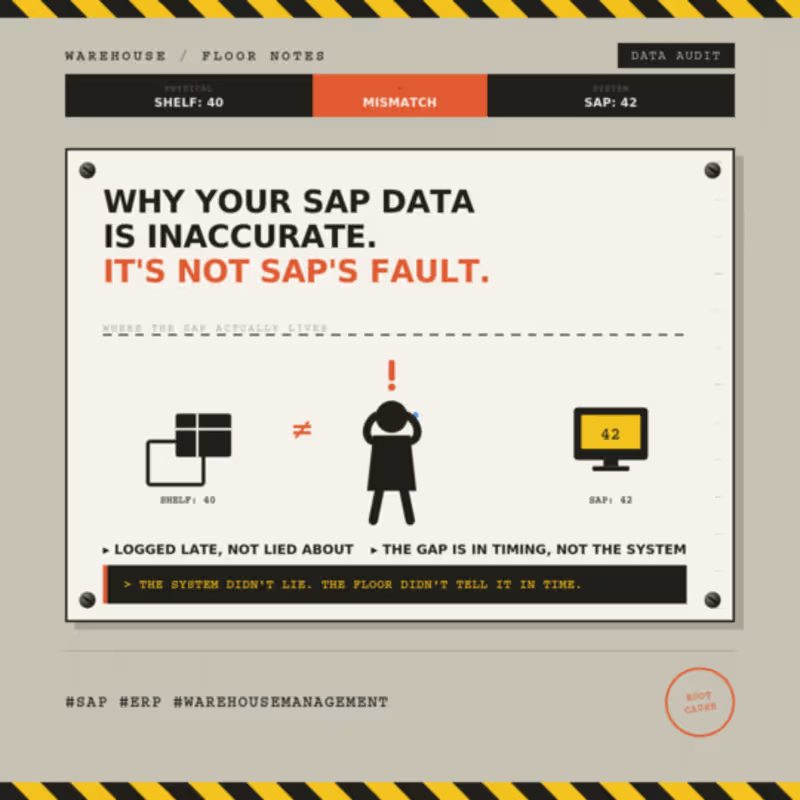
Why your SAP data is inaccurate β and it's not SAP's fault. Every time someone tells me "our SAP data is a mess," I ask a few questions, and almost every single time, the answer has nothing to do with SAP. The system did exactly what it was told, exactly when it was told. If the number on screen doesn't match what's actually on the shelf, something happened on the floor that never made it into the system β or it made it in late, or someone found a shortcut because doing it properly during a busy shift felt like a luxury nobody had time for. Picture this: the shelf says 40. SAP says 42. Nobody's lying β the count on screen is just repeating something that was entered wrong, or late, or never corrected. I've seen the same handful of patterns show up again and again, at different sites, with completely different teams. Someone unloads a truck, and the goods receipt doesn't get posted until hours later because paperwork felt like it could wait until things calmed down. By the time it's finally entered, nobody actually remembers if it was 40 units or 42 β so whatever gets typed in is really just a best guess dressed up as data. Or transactions get batched at the end of a shift instead of logged as they happen. The timestamps look fine, but the actual sequence of events is gone, which means when something doesn't match later, there's no way to trace back what caused it. Or someone just overrides the number to make it "correct" for now, without asking why it was wrong in the first place. That fixes the symptom for exactly one day. The actual cause is still sitting there, waiting to cause the same problem next week. And honestly, a lot of training doesn't help either β people get taught which buttons to press, but nobody explains why the timing or the order of steps actually matters. So they follow the steps, but they have no idea what breaks the moment one gets skipped. None of this ever shows up as a system error. It just shows up as "SAP's wrong again," which is usually the one explanation that isn't actually true. The fix is almost never a system change. It's a behavior change β closing the gap between the moment something physically happens and the moment it gets recorded, and making the right way to log it the easy way instead of the slow one. If your numbers keep drifting from reality, the system isn't lying to you. It's just repeating exactly what it was told.
0
102
0
I spent the first couple of years treating inventory accuracy like a fire drill. Count everything the week before month-end, patch whatever didn't match, submit the report, forget about it until next month. It worked, technically. Once. Then the small gaps started piling up faster than I could explain them. What actually changed things wasn't a new tool or a new SOP. It was realizing IRA isn't something you report on β it's something you either protect every day or you don't. Every goods receipt, every issue, every transfer is a moment where the system and the actual shelf can quietly drift apart. Catch that drift the same day and it's a two-minute fix. Let it sit for three weeks and it turns into a full investigation, and usually nobody remembers what actually happened. A few things I've genuinely stuck to since then: Reconcile the same day, not at month-end. I know it sounds obvious written down, but most warehouses don't actually do this β batching corrections is just easier in the moment. Let SAP flag mismatches early instead of waiting for someone to physically count and notice. The system usually knows before the floor does. Ask what kind of discrepancy it is before writing it off β receiving error, system delay, handling mistake. They all look the same on a report and none of them are fixed the same way. Whoever touched the transaction is the one who catches the error. Not an audit team three weeks later going through paperwork. None of this is glamorous. It's mostly just refusing to let small things wait. But it's the reason we held 100% month-end IRA consistently, and it's also the reason the number actually meant something when auditors came through β not just a figure that looked clean on a slide. If there's one thing 7 years taught me, it's that inventory accuracy was never really about the count. It was about how disciplined the process stayed on the days nobody was watching. #InventoryManagement #SupplyChain #FMCG
0
73
Data Modelling Analyst
(1)
Follow
Message
Hamza Mooraj
Karachi, Pakistan
Applied AI Engineer | LLM Fine-Tuning & RAG

Follow
Message
Applied AI Engineer | LLM Fine-Tuning & RAG

0
Diabetes Risk Prediction with Neural Networks
0
4
0
AI Learning Buddy β RAG Academic Assistant
0
3
0
Multimodal Medical QA Assistant with RAG
0
3
0
Vision-Model Benchmarking for Crop Disease Classification
0
4
Data Modelling Analyst
(1)
Follow
Message
Adil Maqsood
Karachi, Pakistan
Interactive Dashboard & ML Expert
Follow
Message
Interactive Dashboard & ML Expert
0
Supervised machine learning
0
5
0
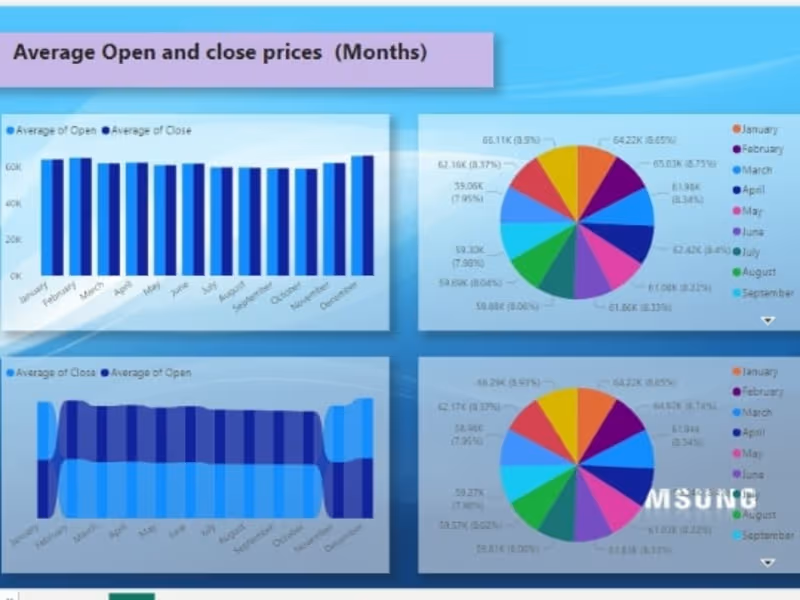
Samsung electronics stock historical prices
0
20
0
GitHub - adilmaqsood1/Data-Science-Projects: EDA and data scienβ¦
0
29
View more β
Data Modelling Analyst
(1)
Follow
Message
Aneeq Abbasi
Karachi, Pakistan
GIS, Data Analytics, Database Specialist & Automation Expert
New to Contra
Follow
Message
GIS, Data Analytics, Database Specialist & Automation Expert
0
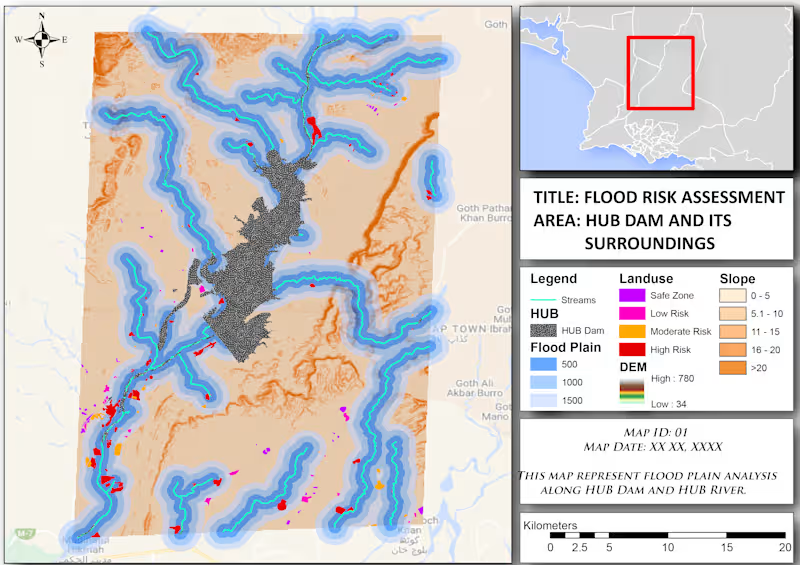
Performed flood risk assessment around Hub Dam by integrating stream networks, multi-distance floodplain buffers, DEM/elevation, slope analysis, and land-use classification to identify safe, low, moderate, and high flood-risk zones.
0
21
0
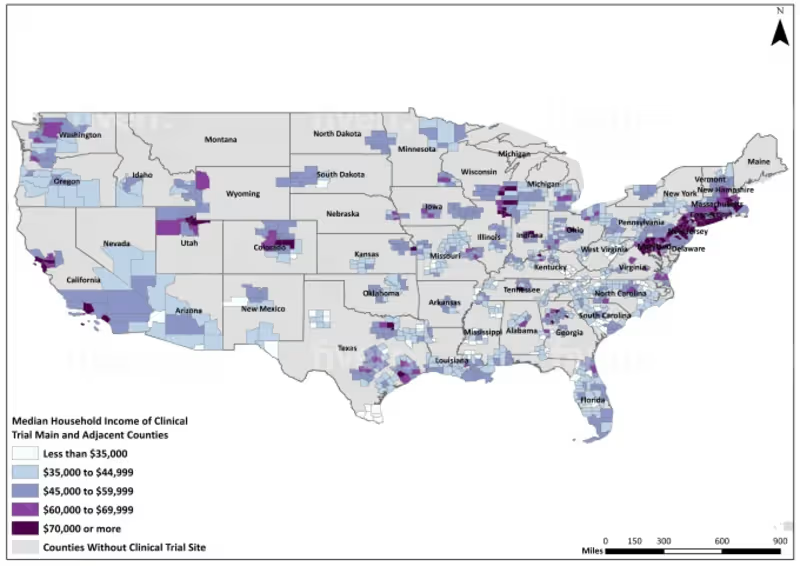
Performed county-level spatial analysis by integrating clinical trial site data with U.S. socioeconomic datasets, classifying median household income ranges, and producing a choropleth map to visualize geographic disparities in clinical trial coverage.
0
7
0
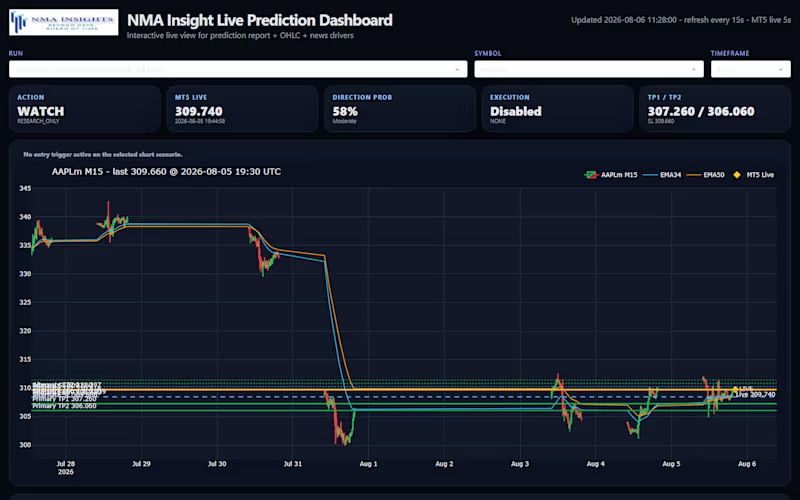
Built an end-to-end Python web application for real-time financial data analysis and prediction, combining live market feeds, technical indicators, predictive analytics, interactive charts, filtering controls, and trade risk metrics in a responsive dashboard.
0
10
0
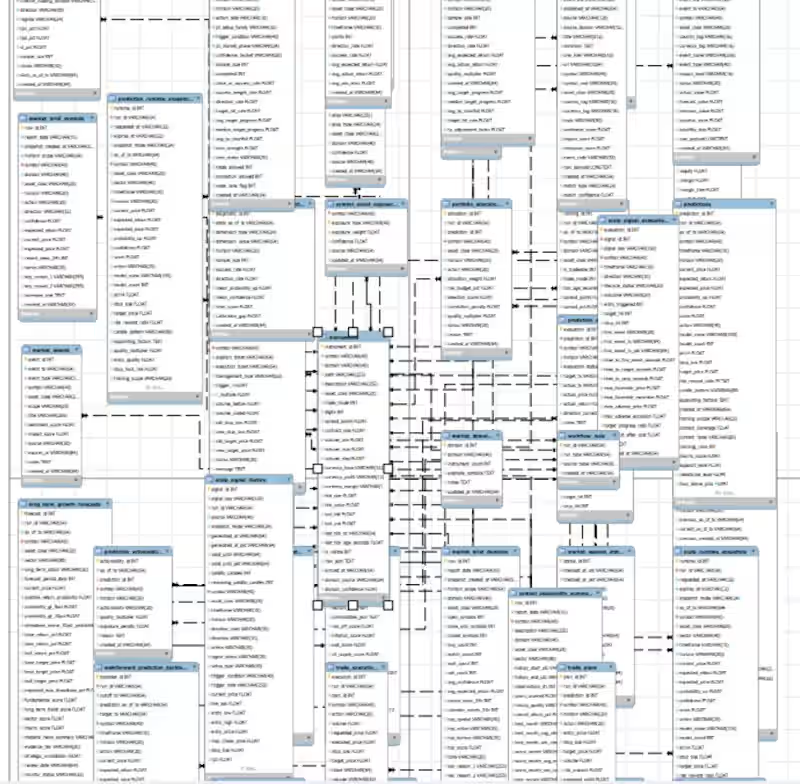
Developed a normalized RDBMS for an automated Forex trading platform, designing interconnected tables and relational schemas to manage market data, technical indicators, ML predictions, trading signals, portfolios, execution records, risk metrics, and backtesting results.
0
14
Data Modelling Analyst
(1)
Follow
Message
Shahid Iqbal
Karachi, Pakistan
NS3 programmer
1x
Hired
5.0
Rating
1
Followers
Follow
Message
NS3 programmer
0
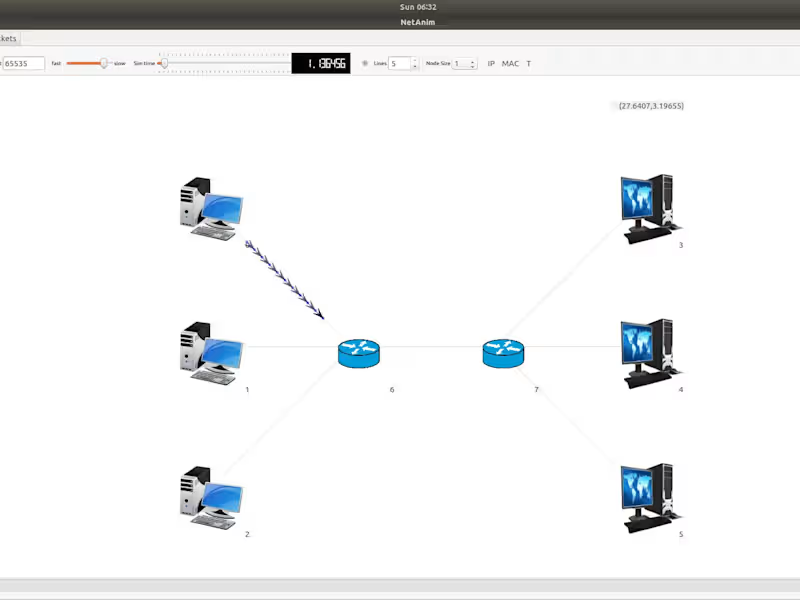
FANET in NS3|Flying Adhoc Network in NS3 - YouTube
0
6
0
Graphic Designing
0
5
0
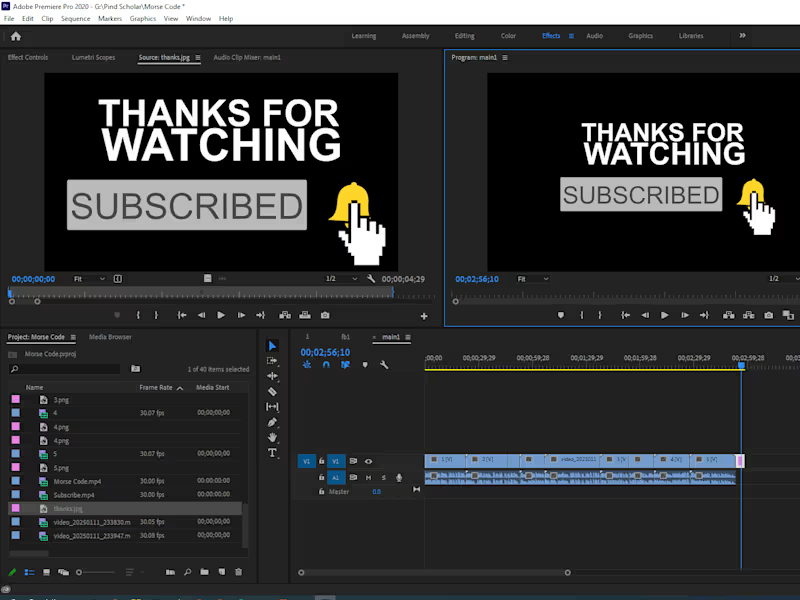
Vidoe Editing for shorts
0
5
View more β
Data Modelling Analyst
(1)
Follow
Message
Explore people