
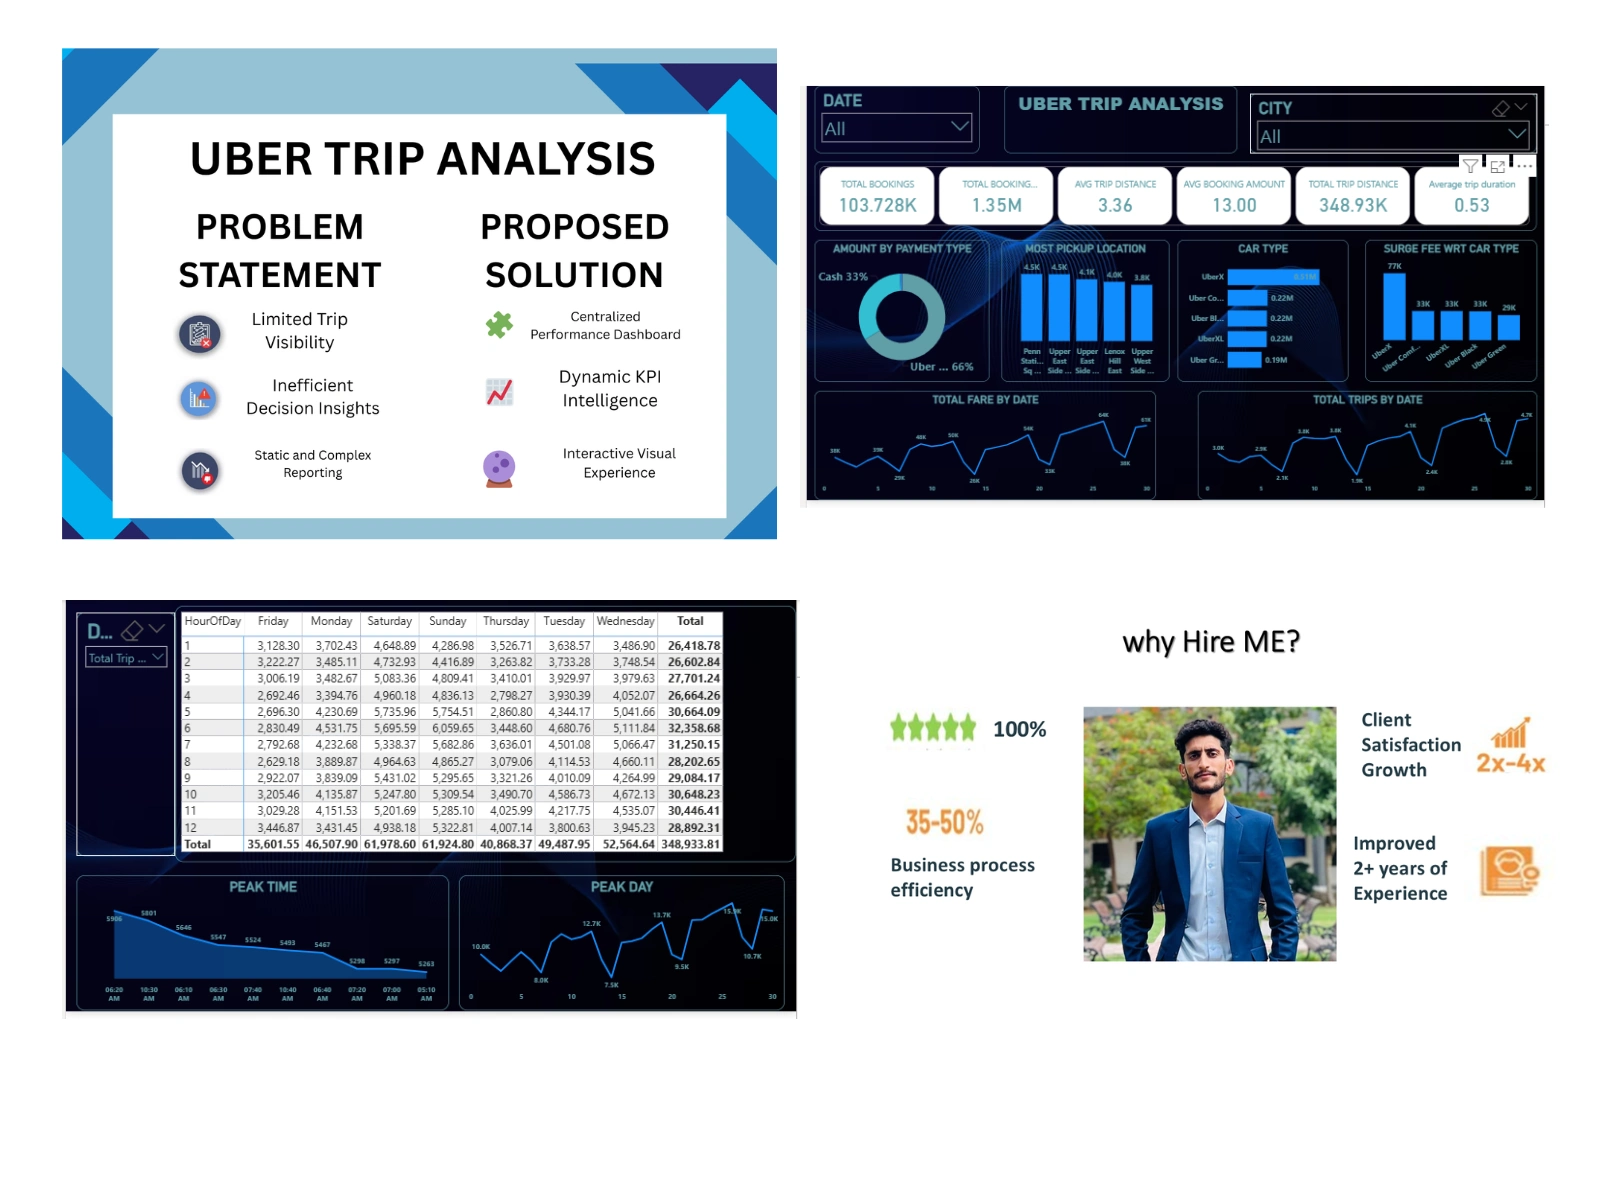
Turned Uber’s trip data into an interactive Power BI dashboard that uncovers real time booking trends, revenue performance, and demand patterns across cities.
By combining SQL, DAX, and dynamic visuals, the dashboard helps identify peak hours, optimize pricing, and improve operational efficiency.
This project showcases how clear data storytelling can transform raw trip data into actionable insights helping teams make faster, smarter business decisions
0 likes · 0 views · Oct 18, 2025
Turned Uber’s trip data into an interactive Power BI dashboard that uncovers real time booking trends, revenue performance, and demand patterns across cities...
Timeline
Sep 1, 2025 - Sep 4, 2025


