Projects using Microsoft Power BI in Dhaka Division
Projects using Microsoft Power BI in Dhaka Division
Sign Up
Post a job
Sign Up
Log In
Filters
2
Projects
People
Message
11
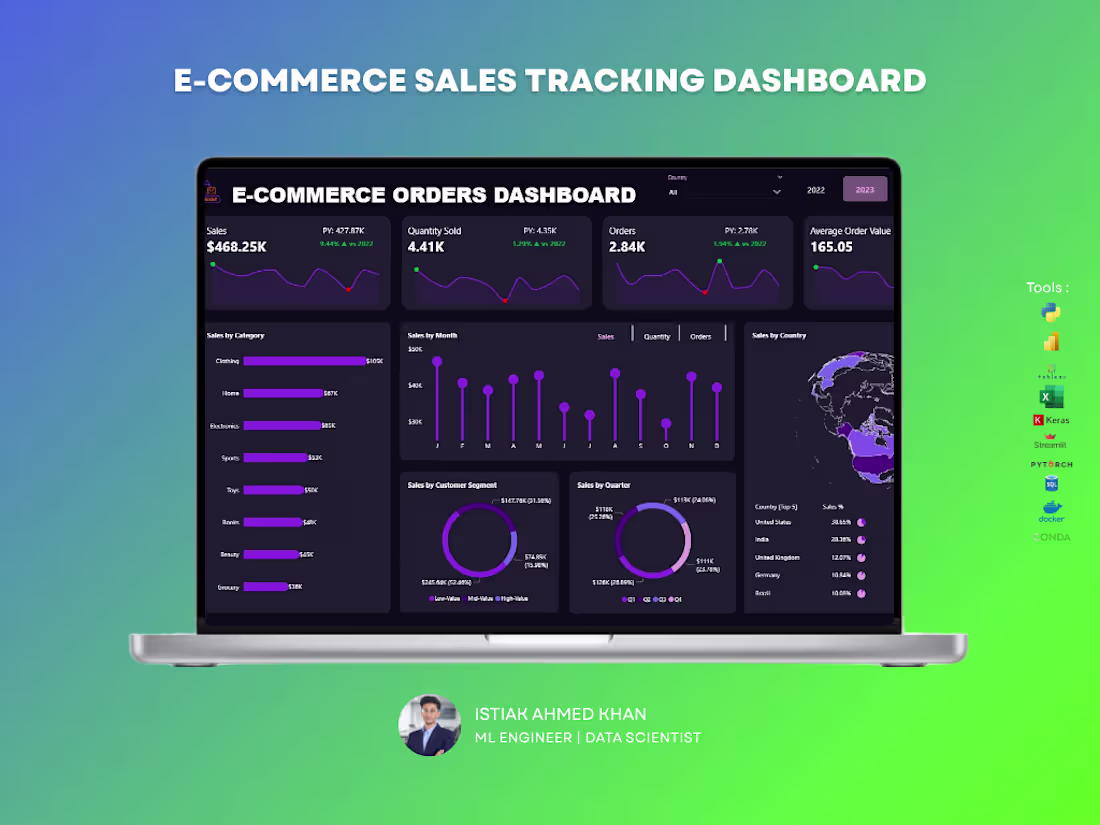
Istiak Ahmed Khan
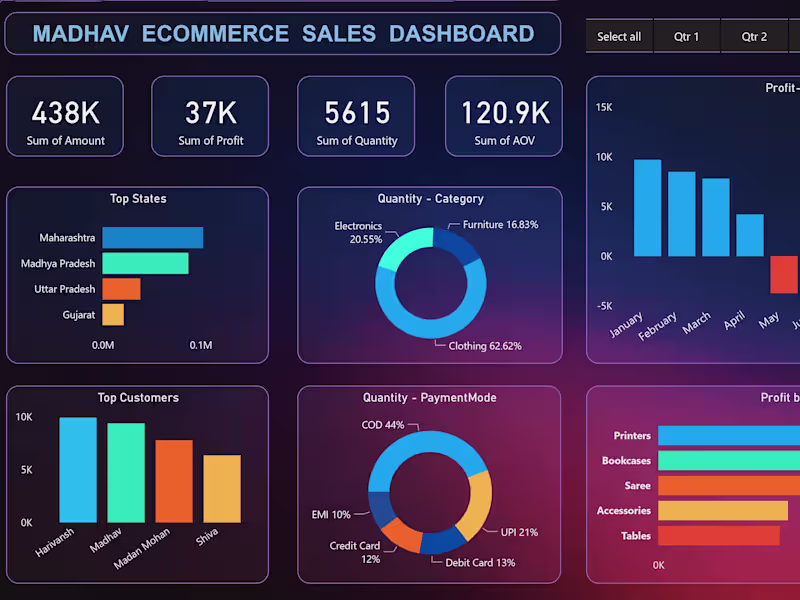
The E-Commerce Orders Dashboard provides a comprehensive overview of order performance, revenue trends, and customer purchasing behavior. Designed for online businesses, this dashboard transforms transactional order data into actionable insights that support growth, operational efficiency, and strategic decision-making.
2
11
1.3K
Message
0
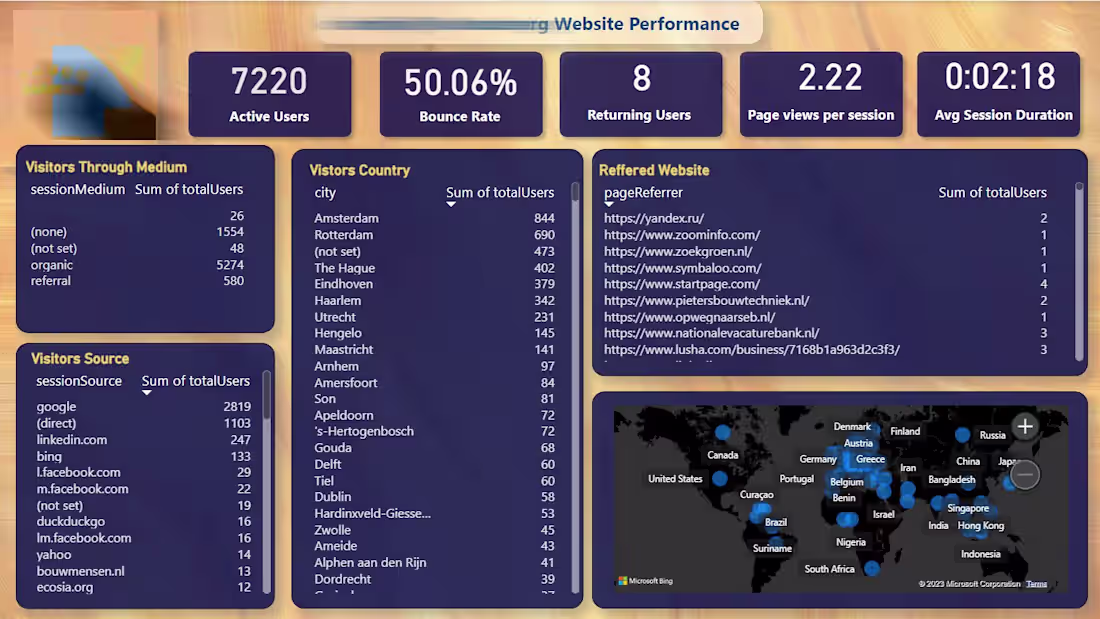
Subrin Al Azad
Marketing Report with Power BI
0
7
Message
0
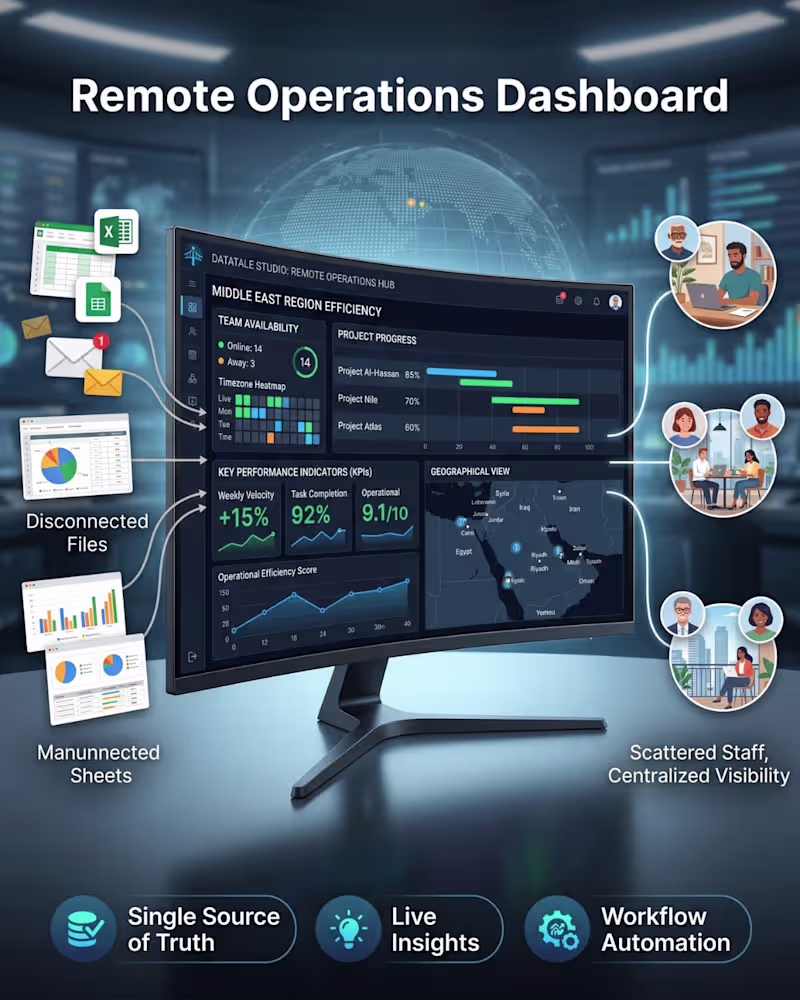
Syeed Ponir
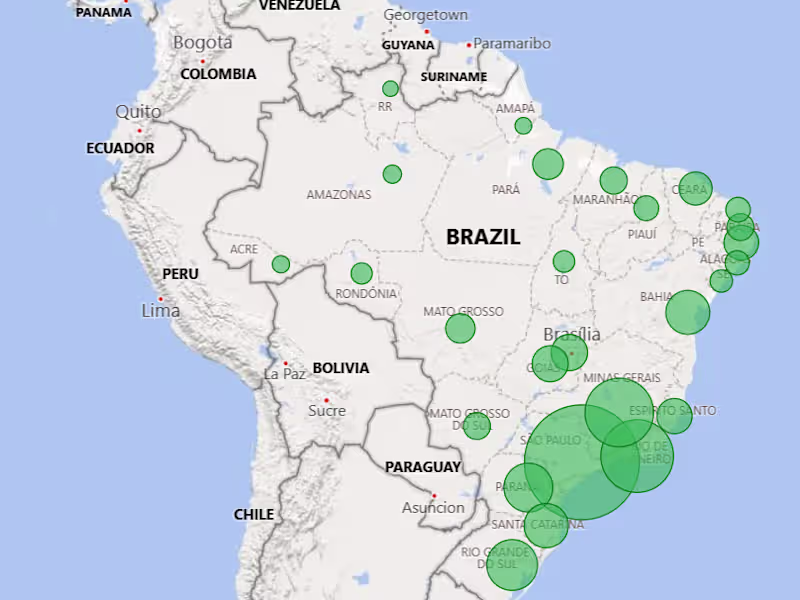
If your remote team still relies on spreadsheets for reporting — this project was made for clients exactly like you. 👇 🖥️ Project: Remote Operations Dashboard for a Middle East Operations Team Here's the before and after: BEFORE working with me: ❌ Data buried across disconnected files ❌ No live visibility into team availability ❌ Project updates delayed by days ❌ Leadership flying blind on KPIs AFTER: ✅ 14 team members tracked live with timezone heatmaps ✅ 3 active projects visualized with real progress % ✅ KPIs automated: velocity +15%, task rate 92%, score 9.1/10 ✅ Full geographical view of the distributed team ✅ One dashboard. Every answer. Instantly. This is what I do — I turn operational chaos into clarity. Whether you're a startup scaling fast or an established team going remote, I'll build you a dashboard that makes you look like you have a full data team behind you. 🟢 Currently available for new projects. 📩 Send me a message on Contra and let's scope your build. 🛠️ Services: Dashboard Design · Business Intelligence · Data Visualization · Remote Operations Systems · KPI Reporting
0
37
Message
4
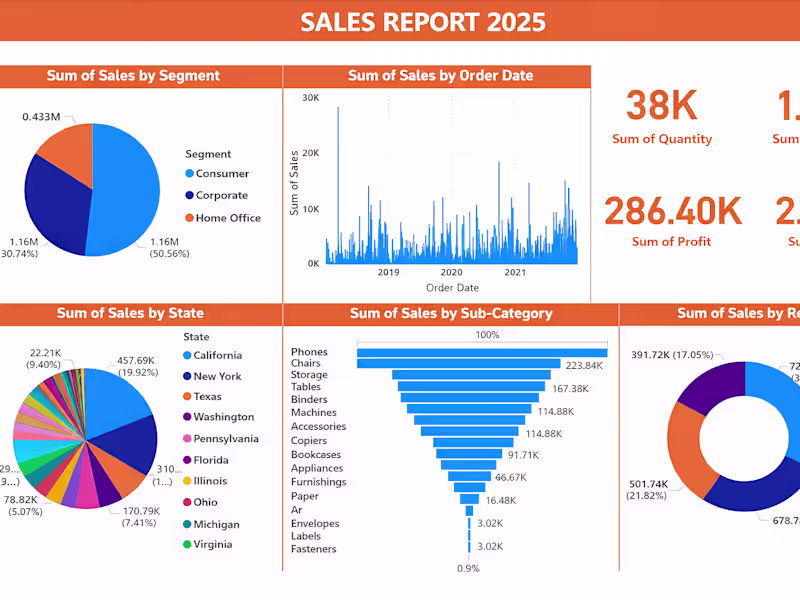
Md. Shohag Hossain
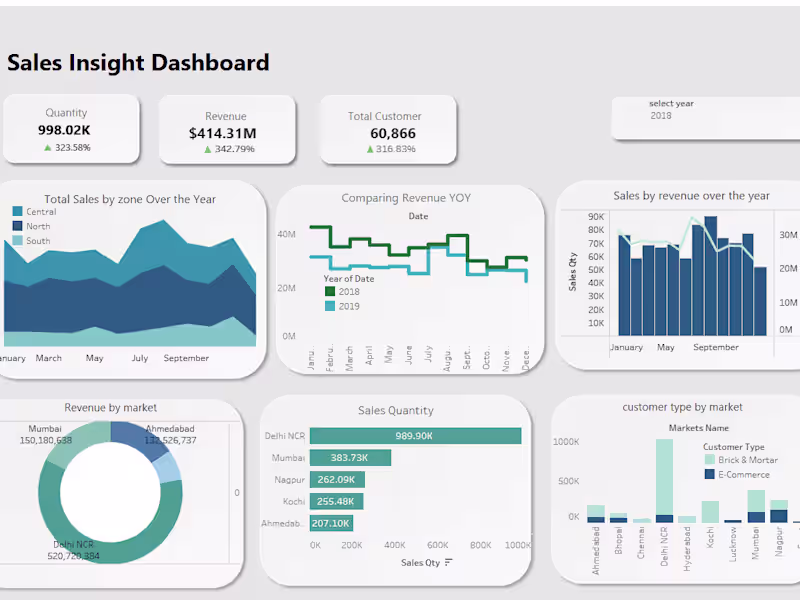
📊 AI-Powered Sales Dashboard | Project Completed I’ve successfully completed this AI-assisted Sales Data Visualization project, transforming raw sales data into a clear, decision-ready dashboard. ✅ What this dashboard delivers: Business-focused KPIs (Sales, Profit, Quantity, Discount) Segment, Region, State & Category-wise performance analysis Clean, modern, client-friendly visual layout Easy insights for fast business decisions 🧠 My Role & Skills: Data cleaning & structuring KPI identification & analysis AI-assisted data visualization Dashboard design & data storytelling 📌 This project is fully completed and ready for real-world business use. I don’t just visualize data — I turn data into business decisions.
6
4
116
Message
1
Maruffuzzman Tanvir
F1 Championship Metric Comparison: Vettel vs Verstappen
1
3
Message
0
Nazmul Islam Rakin
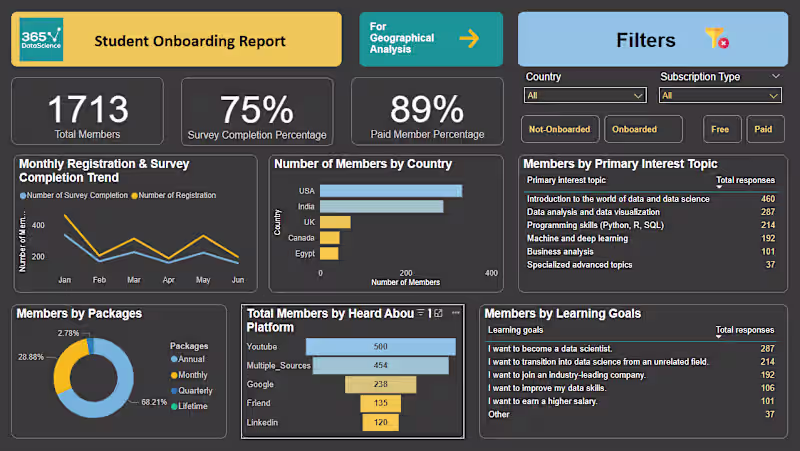
365datascience Onboarding Report
0
36
Message
0
MOHAMMAD ULLAH
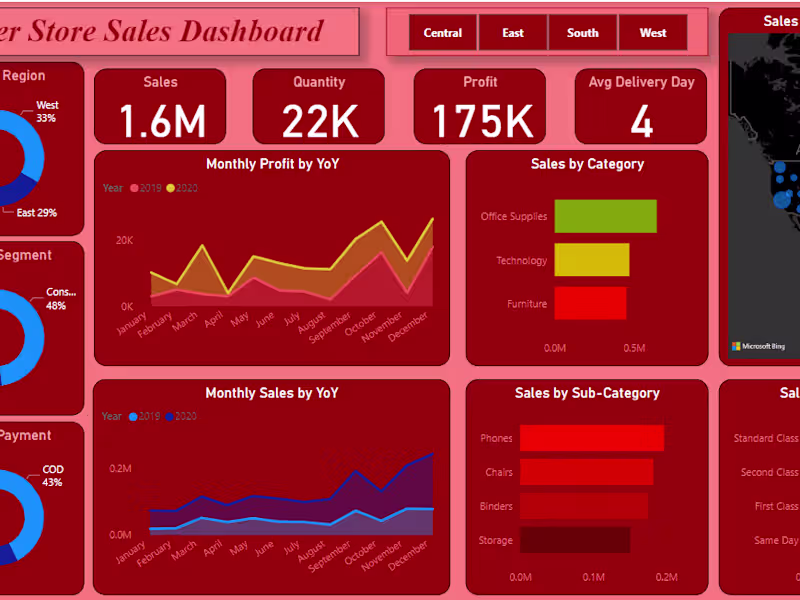
Superstore sales analysis with PowerBI Project
0
25
Message
0
Navid Al Azim
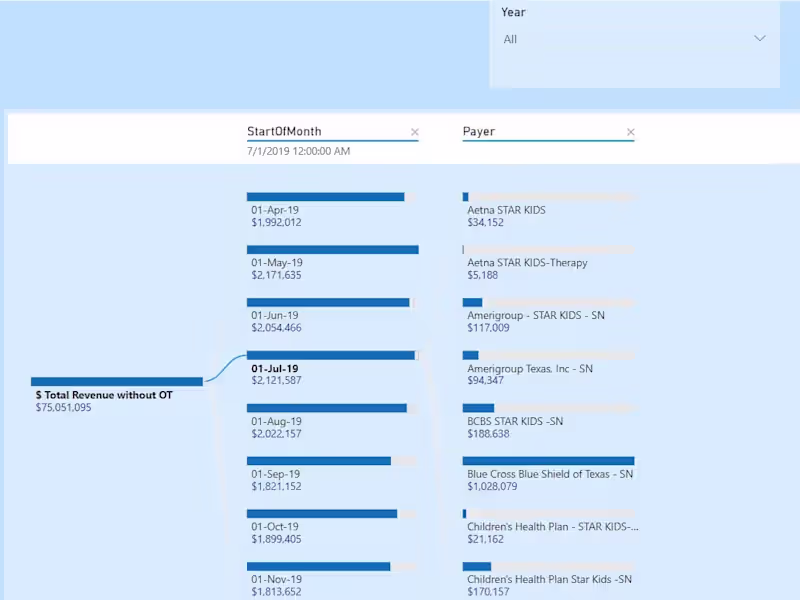
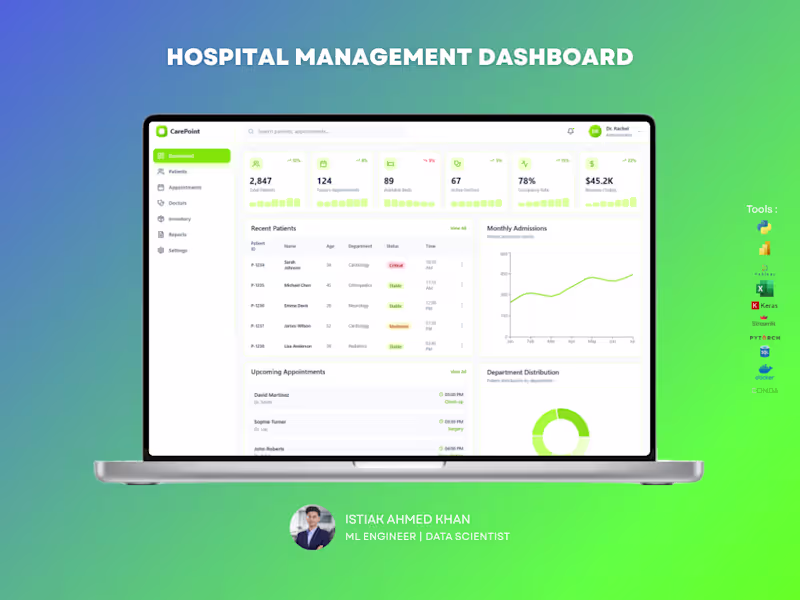
Healthcare Data Management and Dashboarding
0
15
Message
0
Syeda Ramima Rafsana Nadia
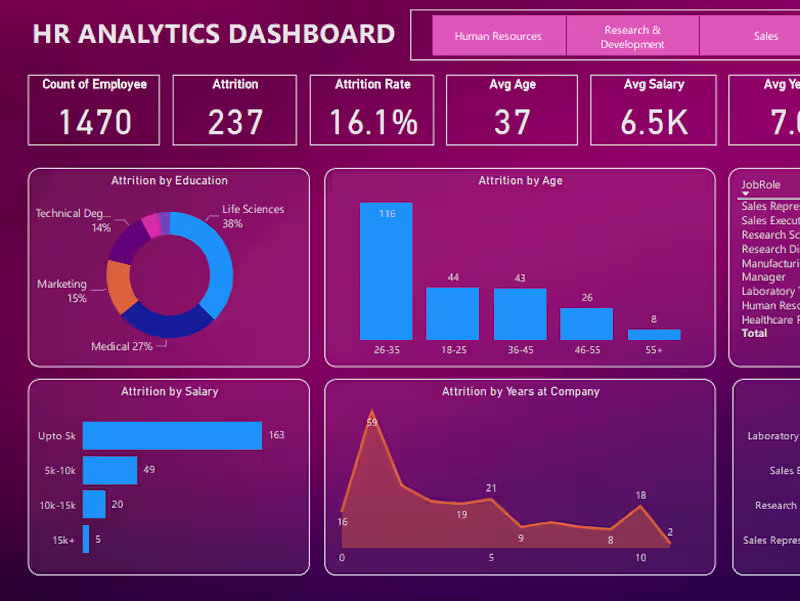
HR Analytics Project
0
6
Message
0
Rakibul Hasan Shanto
SALE S ANALYSIS DASHB OARD
0
10
Message
0
Mohammad Wahidul Islam
Power BI Dashboard
0
24
Message
18
Istiak Ahmed Khan
Email Marketing Analytics Dashboard – UI/UX Design Struggling to track campaign performance across multiple channels? This dashboard is designed to give you a complete, real-time view of your marketing efforts in one clean and intuitive interface. A powerful, easy-to-use dashboard that helps you monitor email, SMS, social media, and push campaigns without the confusion of scattered data. Every key metric is presented clearly so you can make faster, smarter decisions. Key Capabilities: Track open rates, click rates, conversions, and revenue in real time, Compare performance across multiple marketing channels, Identify your top-performing campaigns instantly, Understand audience engagement with clear visual breakdowns, Spot trends and optimize campaigns quickly. Most businesses run campaigns but struggle to understand what’s actually working. This dashboard eliminates guesswork by turning your data into clear, actionable insights — helping you improve ROI and scale winning strategies. Perfect For: Digital marketers, E-commerce brands, Agencies managing multiple campaigns, Startups looking to optimize growth. If you want a high-converting, professional dashboard that not only looks great but drives real business decisions — I can help you build it.
8
18
945
Message
1
Syeed Ponir
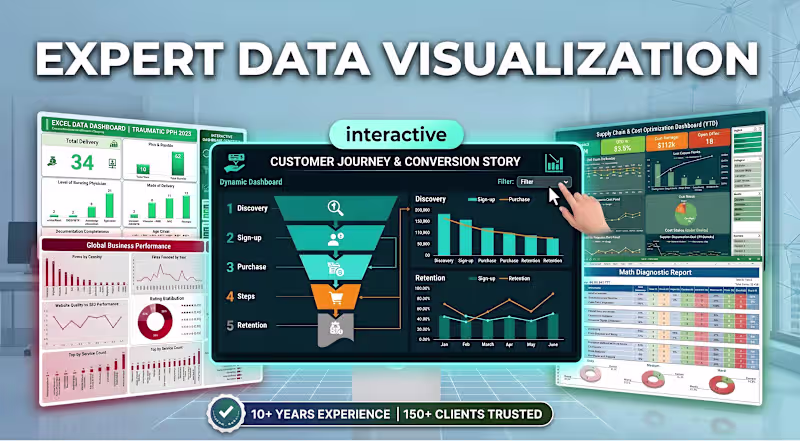
Data is only valuable if it tells a clear story. 📉 If you are tired of digging through static, confusing spreadsheets to find your KPIs, it's time for an upgrade. Welcome to DataTale Studio. I specialize in Expert Data Visualization, engineering interactive dashboards that turn complex, messy data into actionable insights. Whether you need to map a Customer Journey funnel, track Global Business Performance, or optimize your Supply Chain, I build the exact visual systems you need to make fast, data-driven decisions. What you get when we collaborate: ✔️ Interactive Dashboards: Filter, sort, and engage directly with your metrics in real-time. ✔️ Executive-Level Clarity: Clean, elegant designs that highlight the numbers that actually matter to your business. ✔️ Proven Expertise: Backed by 10+ years of data analytics experience and trusted by 150+ clients globally. Stop guessing and start analyzing. If you are ready to transform your corporate reporting, check out my services and send an inquiry to start building your custom interactive dashboard today! 📊
1
97
Message
0
Maruffuzzman Tanvir
Olist-ecommerce-analysis
0
3
Message
0
Nazmul Islam Rakin
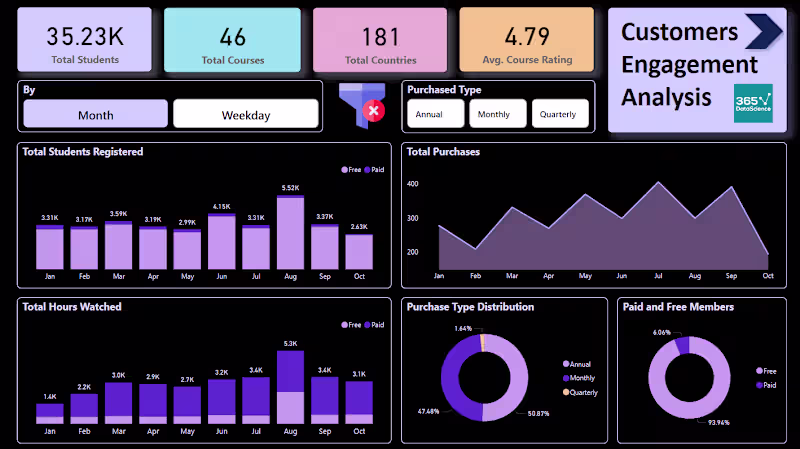
Customer Engagement Analysis Report for 365datascience Platform
0
20
Message
0
MOHAMMAD ULLAH
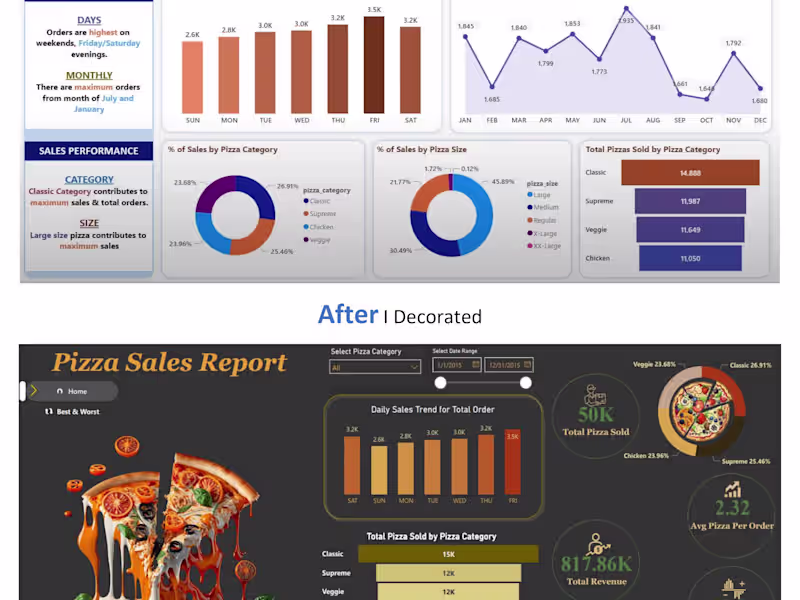
Crafted Pizza Sales Success with Power BI Mastery
0
30
Explore projects