UX-led product design & dev agency for b2b saas and AI
UX-led product design & dev agency for b2b saas and AI
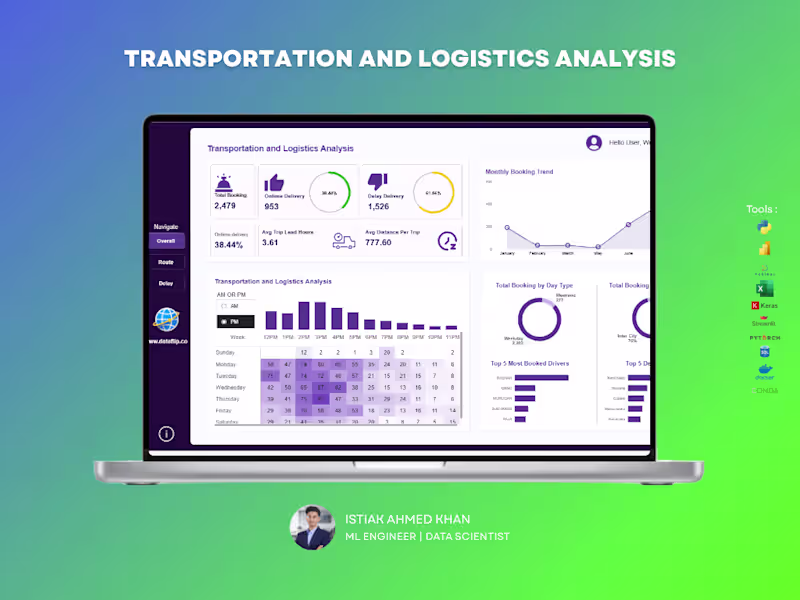
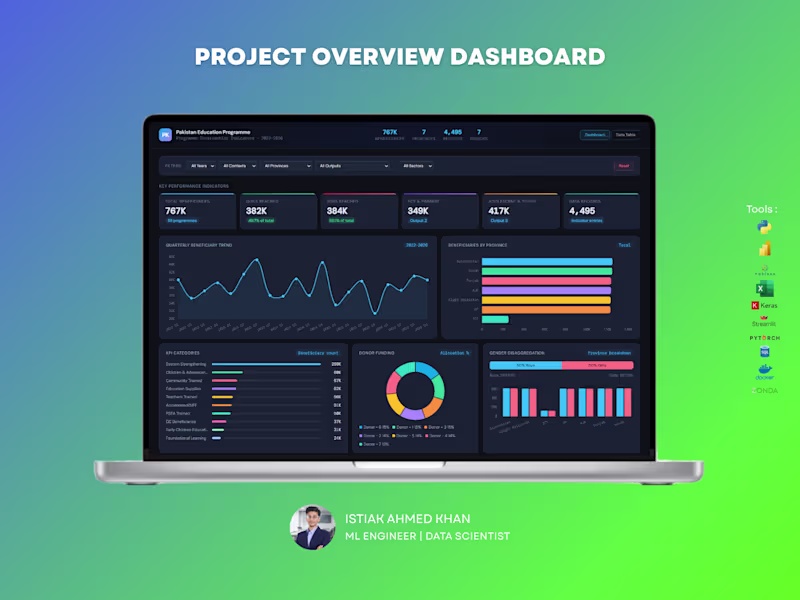
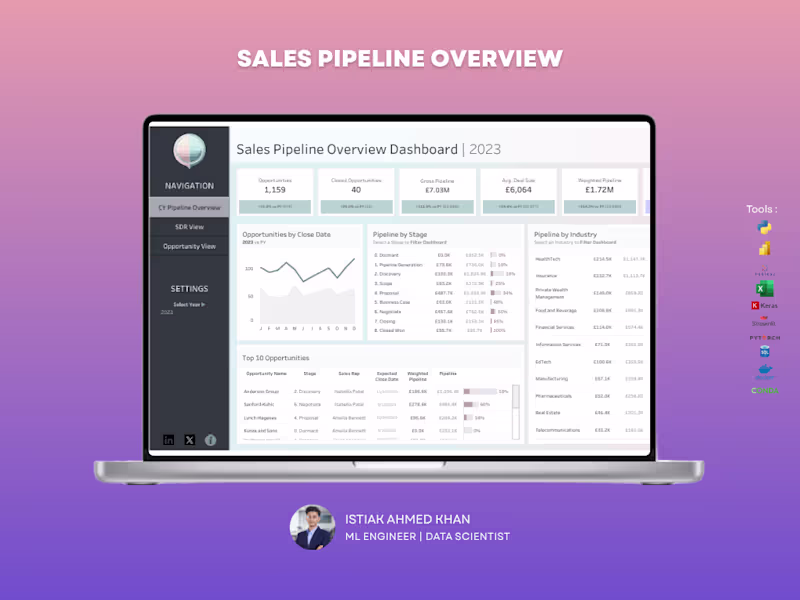
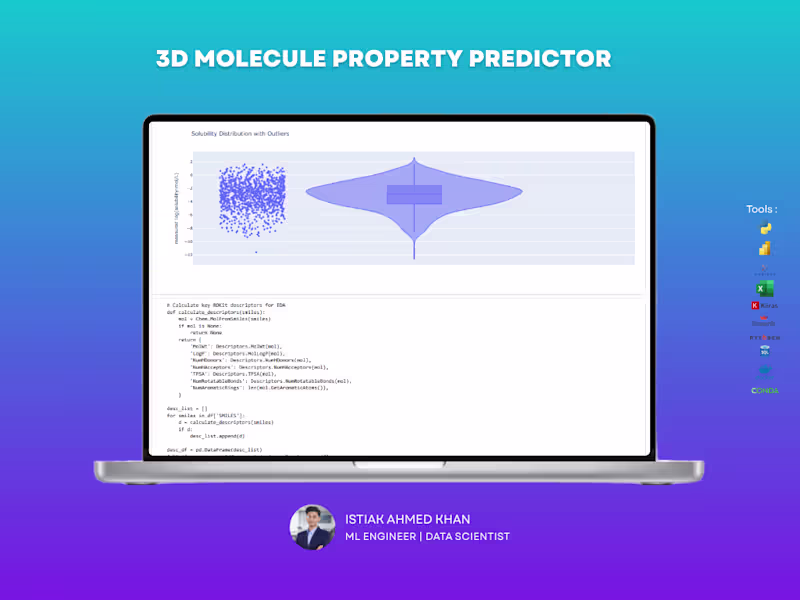
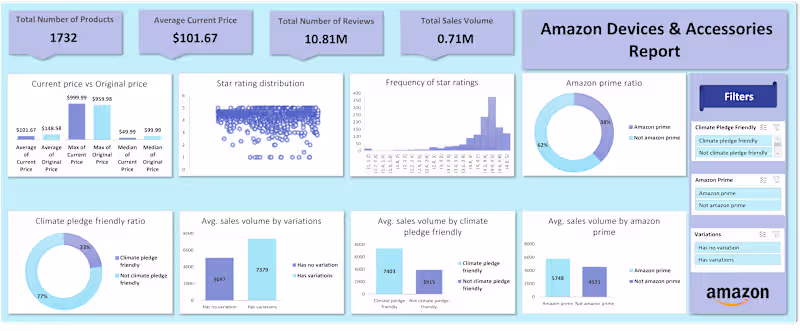
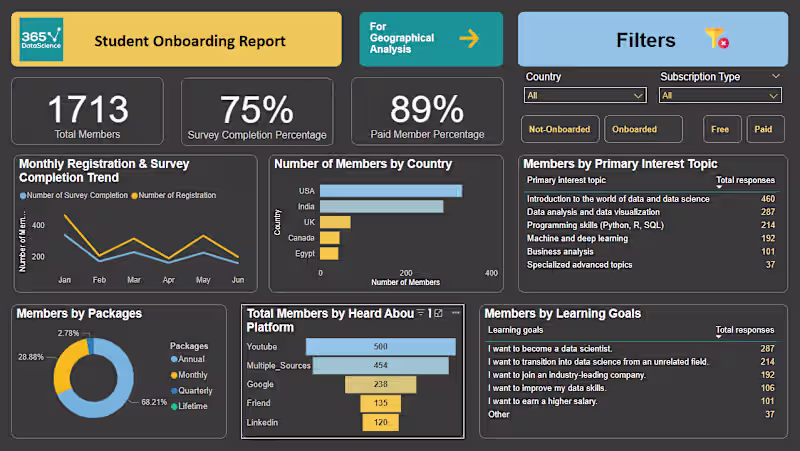
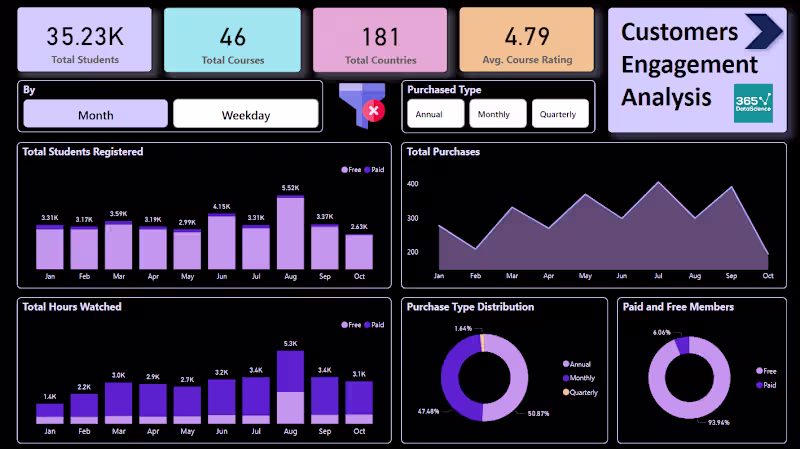
Power BI Data Analyst + ML AI Automation Expert
- 5.0
- Rating
- 101
- Followers
Power BI Data Analyst + ML AI Automation Expert
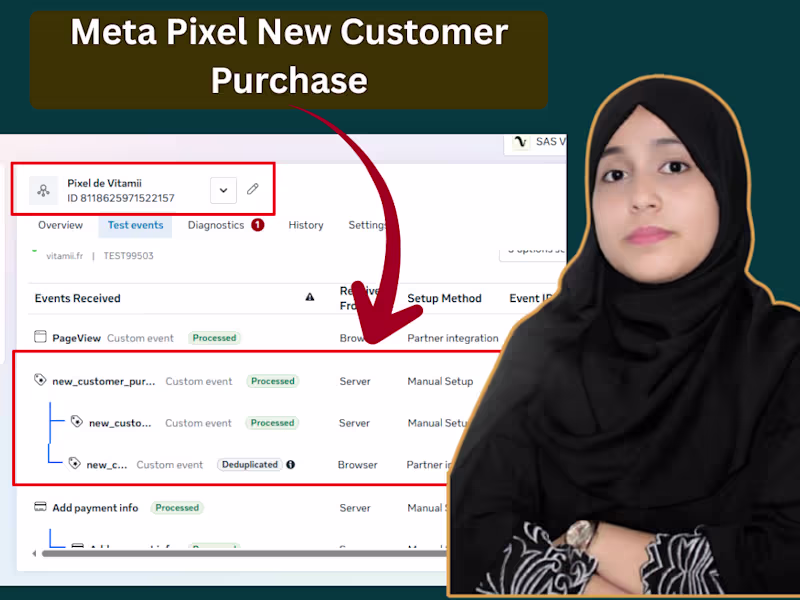
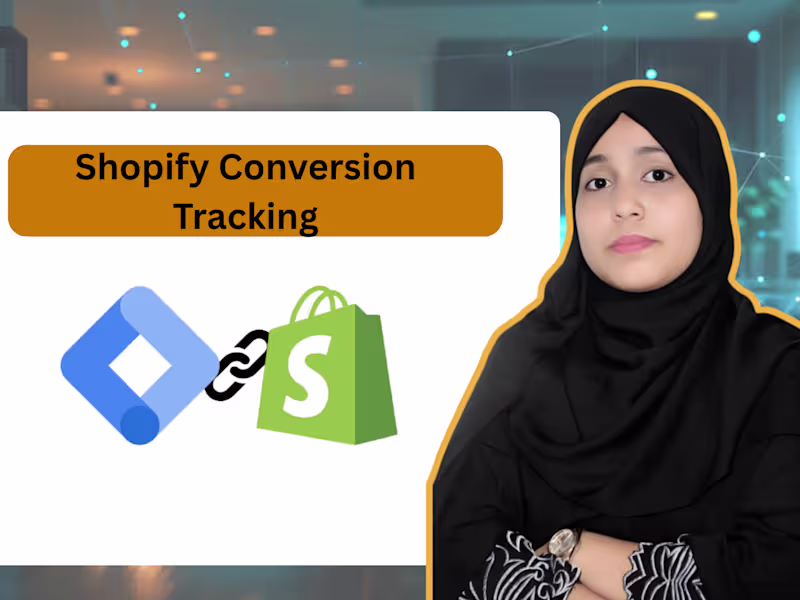
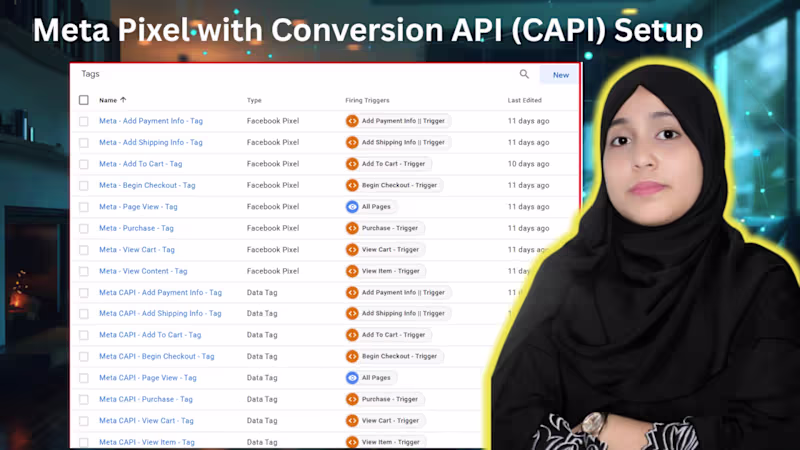
Google Analytics, Meta Pixel | Server-Side Tracking Expert
New to Contra
Google Analytics, Meta Pixel | Server-Side Tracking Expert
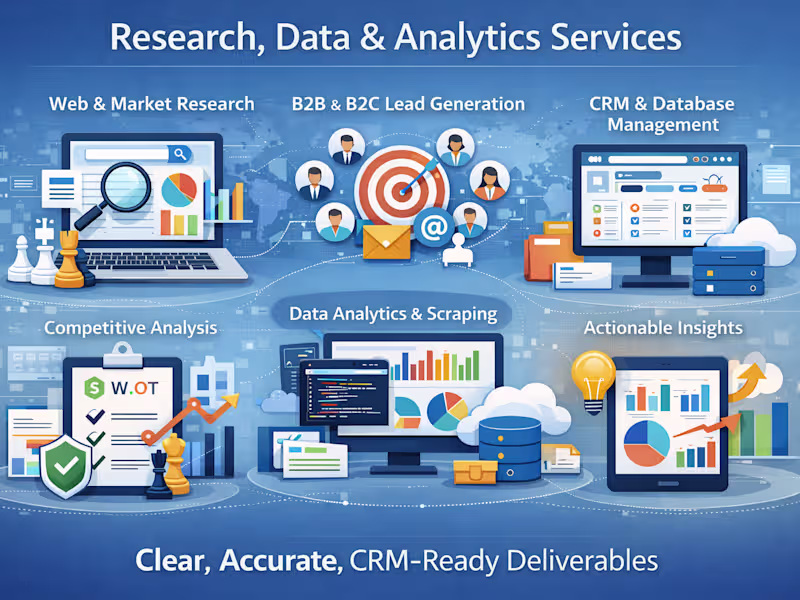
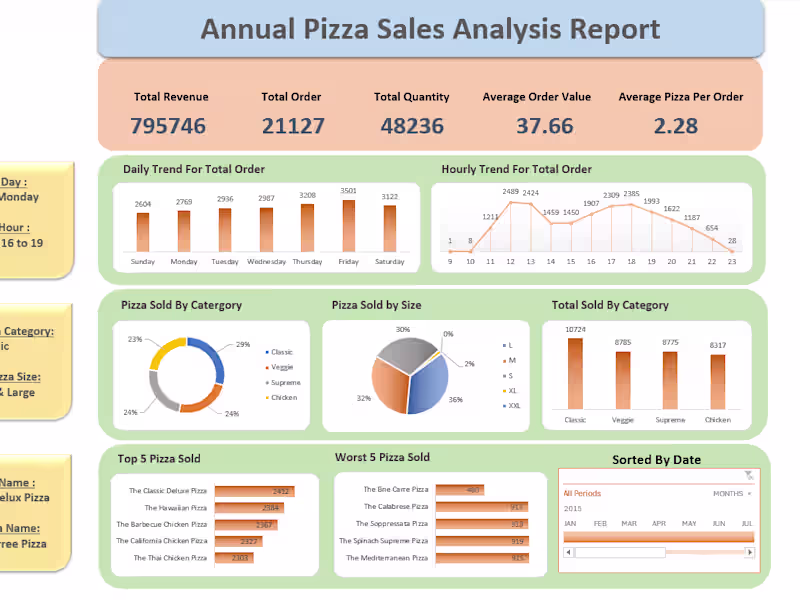
Global Product Sourcing, Conversion Optimization, BI Report
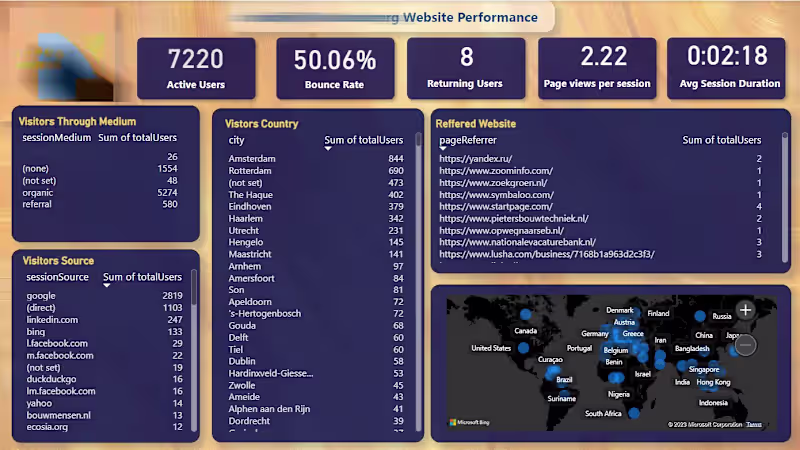
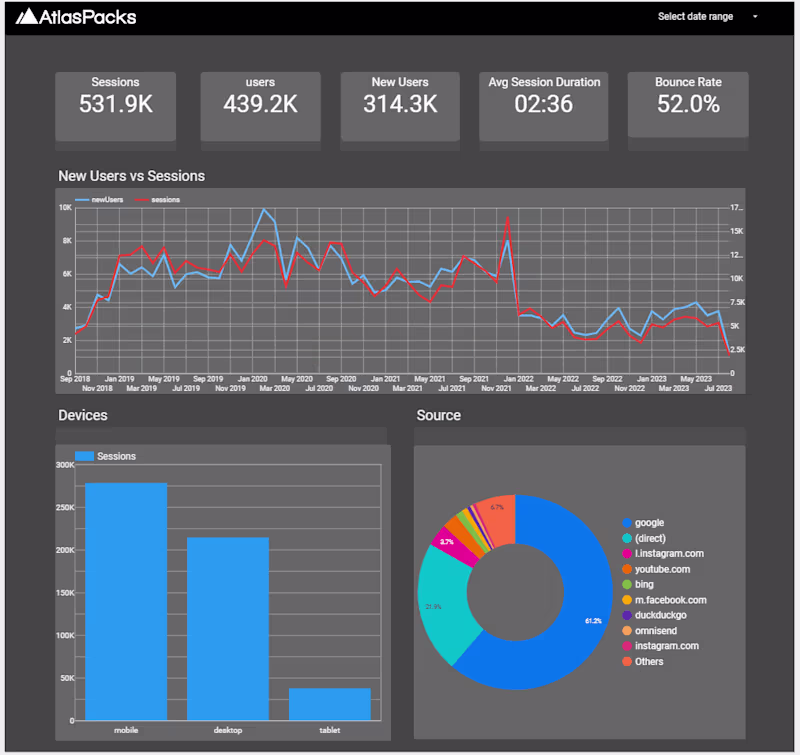
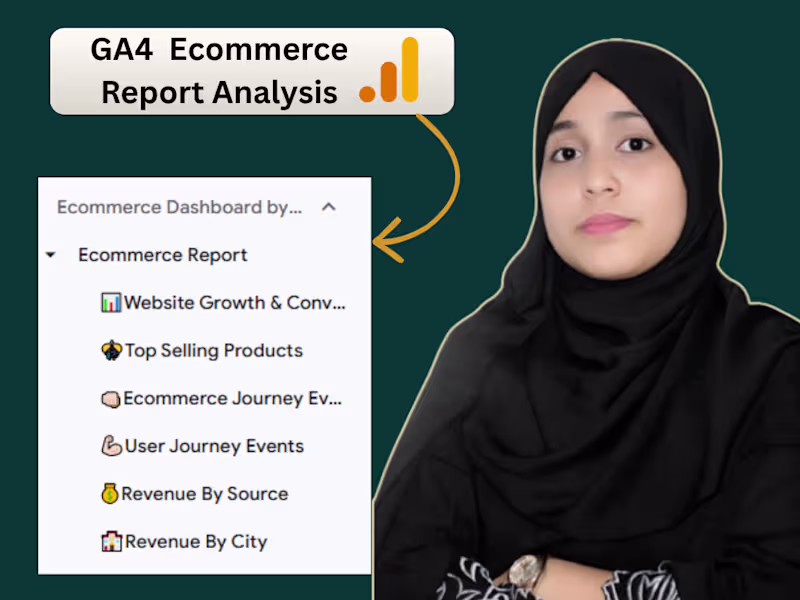
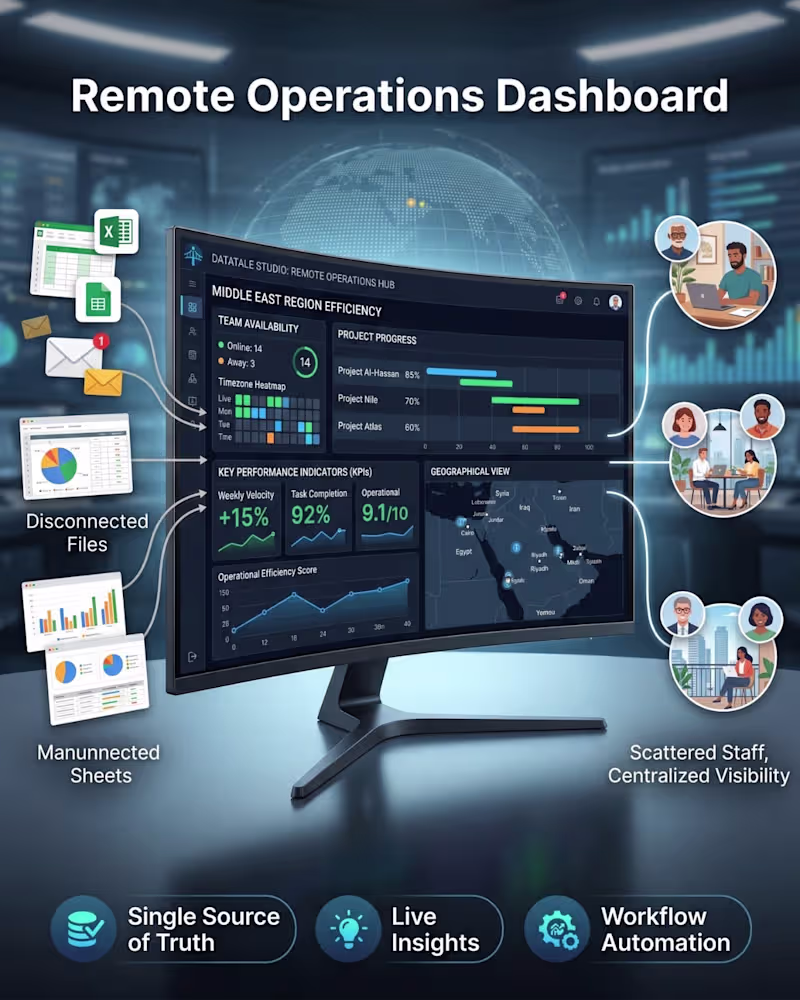
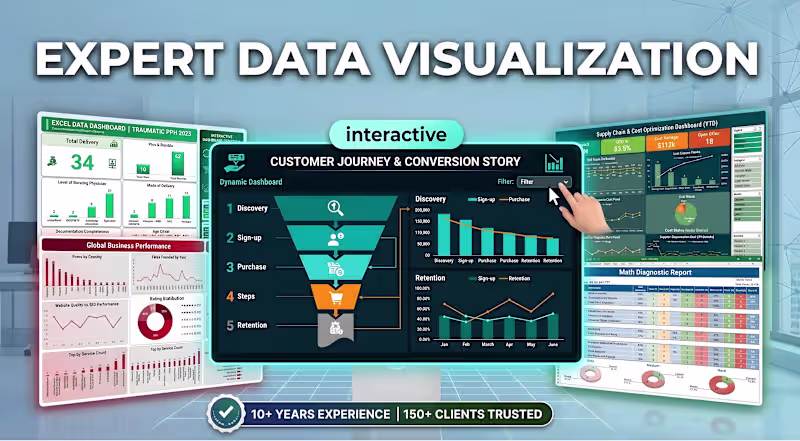
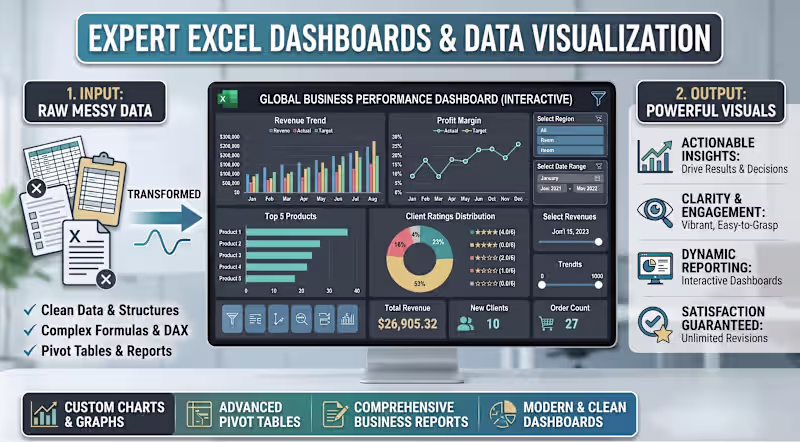
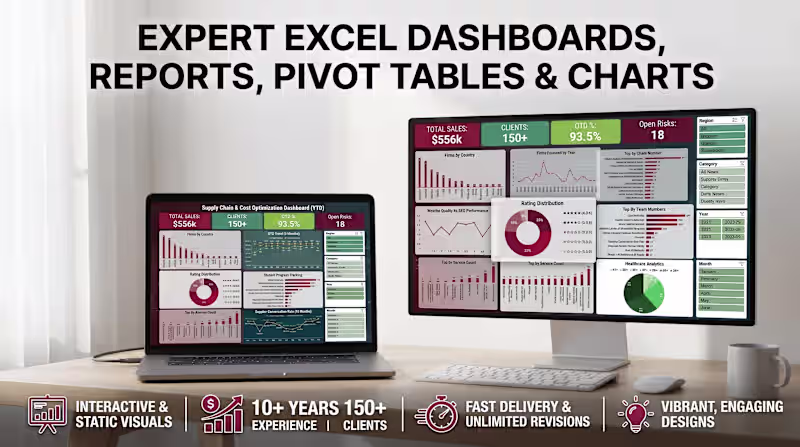
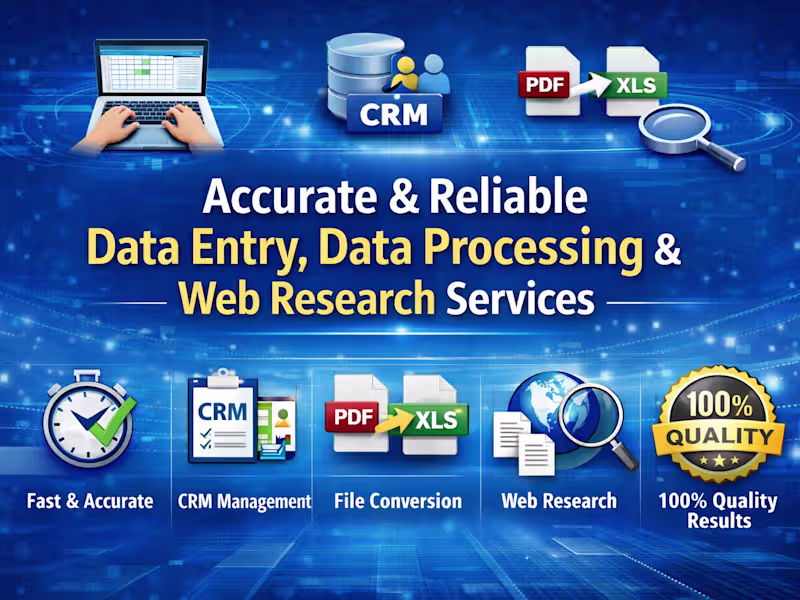
Data Analyst transforming raw data into actionable dashboard
Data Analyst transforming raw data into actionable dashboard
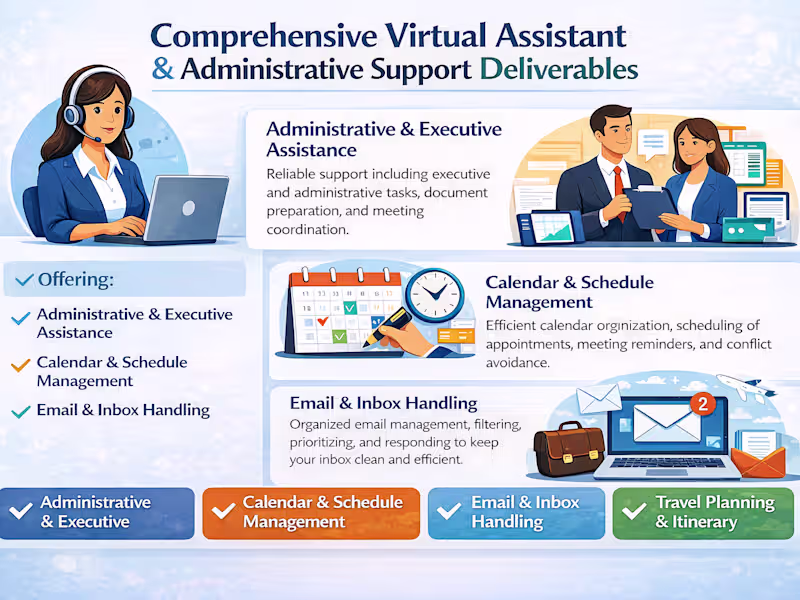
Virtual Assistant, Web Research, Data & Operations Support
New to Contra
Virtual Assistant, Web Research, Data & Operations Support

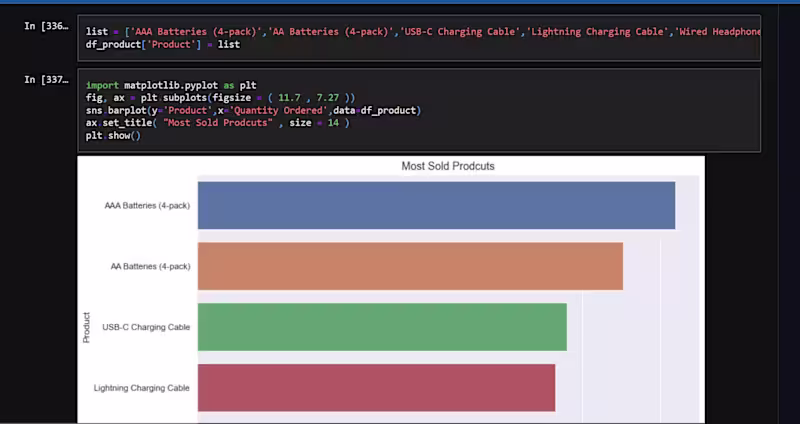
Data analyst | Python | SQL | Tableau | Excel | Power BI
Data analyst | Python | SQL | Tableau | Excel | Power BI
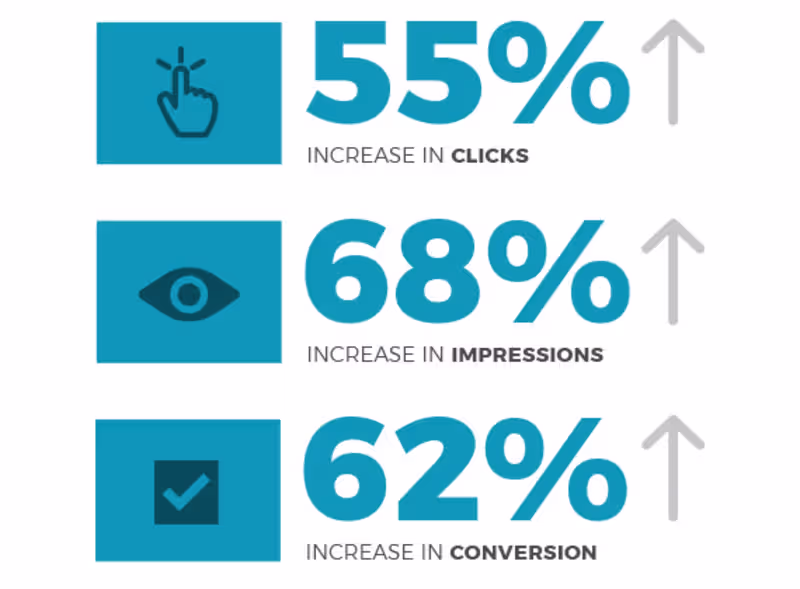
Google Ads Expert 💥
Google Ads Expert 💥


View more →