Freelancers using Microsoft Teams in Delhi
Sign Up
Post a job
Sign Up
Log In
Filters
2
Projects
People
Khushi Garg
Delhi, India
Designing Experiences That Click | Gold Medalist
5.0
Rating
5
Followers
Follow
Message
Designing Experiences That Click | Gold Medalist
2
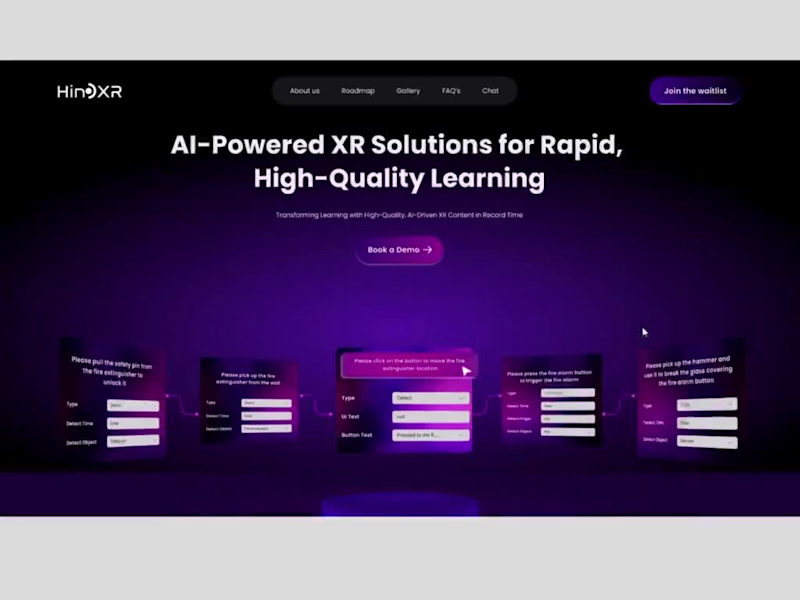
HindXR : Website Design
2
18
2
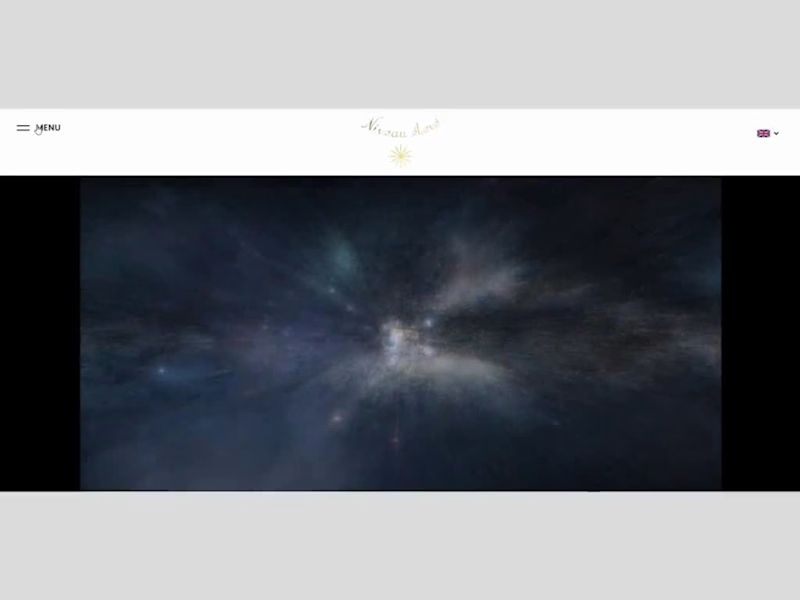
Niveau-Eleve : Website Redesign
2
16
2
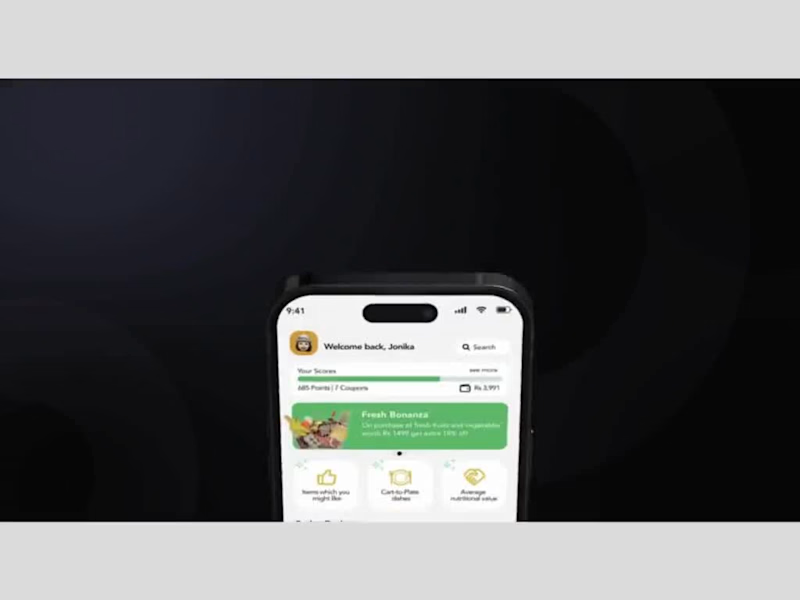
Shop Genie : Mobile App design
2
17
View more ā
Microsoft Teams
(1)
Follow
Message
Andalib Khusro
Delhi, India
Google & Meta Ads for B2B SaaS | Lead Gen Specialist
Follow
Message
Google & Meta Ads for B2B SaaS | Lead Gen Specialist
0
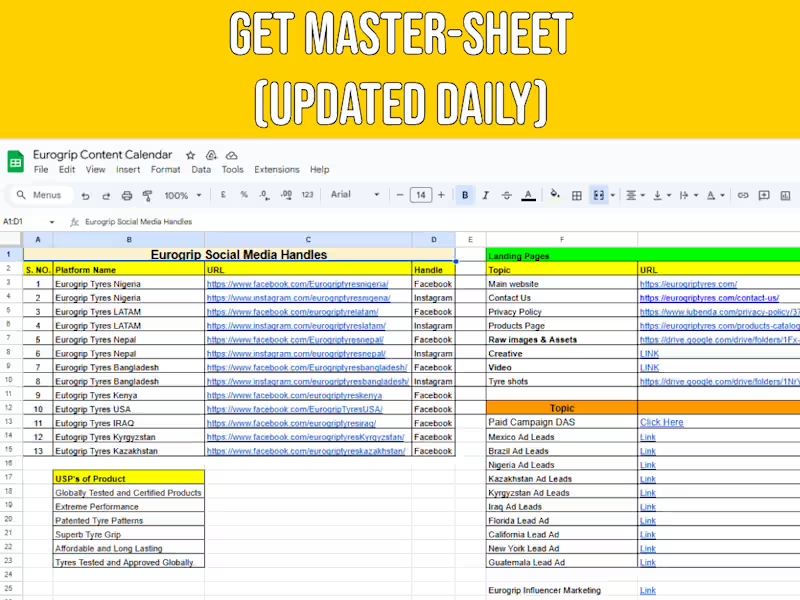
Get Meta ads- simplified content flow.
0
86
1
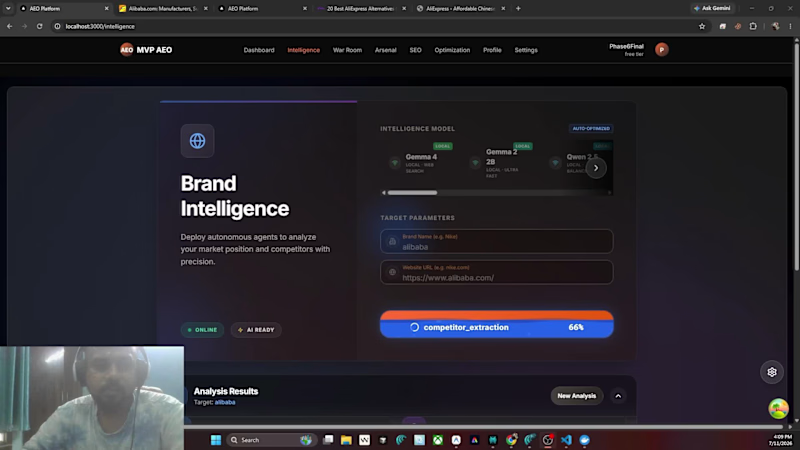
I tried to build AEO tool myself by vibe_coding it. Even though I am a Digital Marketer, PPC specialist. It is not fully working yet but would love feedback from fellow freelancers on ui, backend or anything you think I should improve in the webapp or in this video . It's my first time posting on any platform.
1
45
0
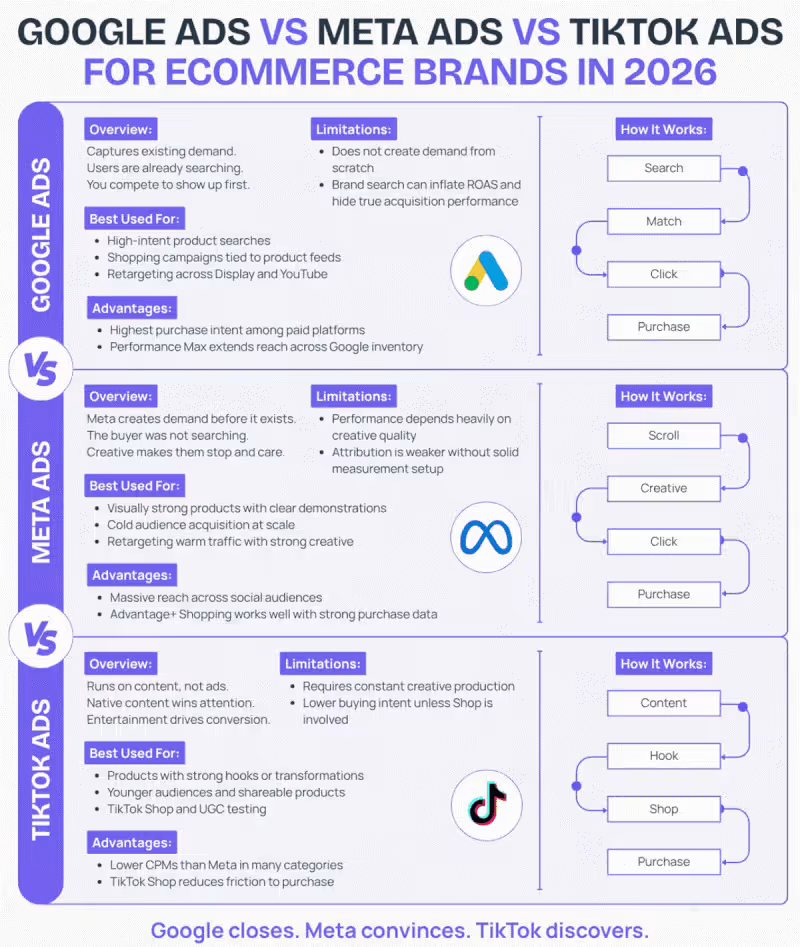
Most ecommerce brands waste budget running all 3 platforms the same way. Here's the truth: Google closes. Meta convinces. TikTok discovers. They're not competitors ā they're a funnel. Google Ads = capture demand that already exists. If someone's searching "buy X" ā you need to be there. High intent, lower funnel, fastest path to purchase. Meta Ads = create demand before it exists. Nobody woke up searching for your product. Meta makes them stop, feel something, and click anyway. Creative is the algorithm. TikTok Ads = discover demand before it becomes demand. Native content, hooks, entertainment-first. TikTok Shop is changing the game for impulse buys. The mistake? Running Google-style creative on Meta. Or expecting TikTok to convert like Search. Each platform has its own psychology. Match the message to the medium. I run full-funnel paid media setups for ecommerce, SAAS B2B brands ā Google + Meta strategy, tracking, and creative direction that actually converts. Working on a paid ads strategy for 2026? Drop a comment or DM me.
0
26
0
Google and meta ads set-up and management.
0
4
Microsoft Teams
(1)
Follow
Message
Poonam Kashyap
Delhi, India
Business Intelligence Specialist | Power BI & Excel Expert
Follow
Message
Business Intelligence Specialist | Power BI & Excel Expert
0
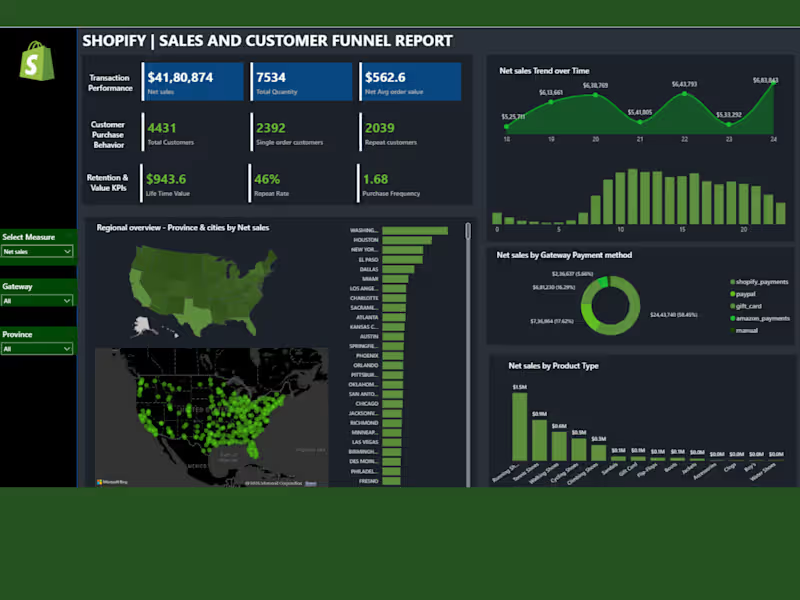
šļø Shopify Sales & Customer Funnel Dashboard (Power BI Project) I designed this interactive Shopify Sales & Customer Funnel Dashboard in Microsoft Power BI to help e-commerce store owners gain deep insights into their sales, customer behavior, and performance trends. The dashboard converts raw Shopify data into a clear visual story that supports smarter, data-driven decisions. Thanks!
0
49
0
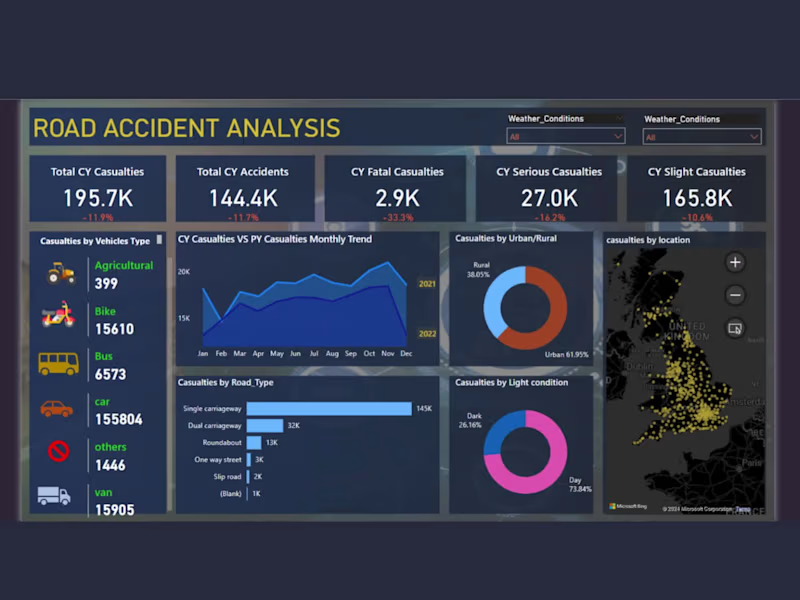
Road Accident Analysis Dashboard ā Power BI Project
0
4
0
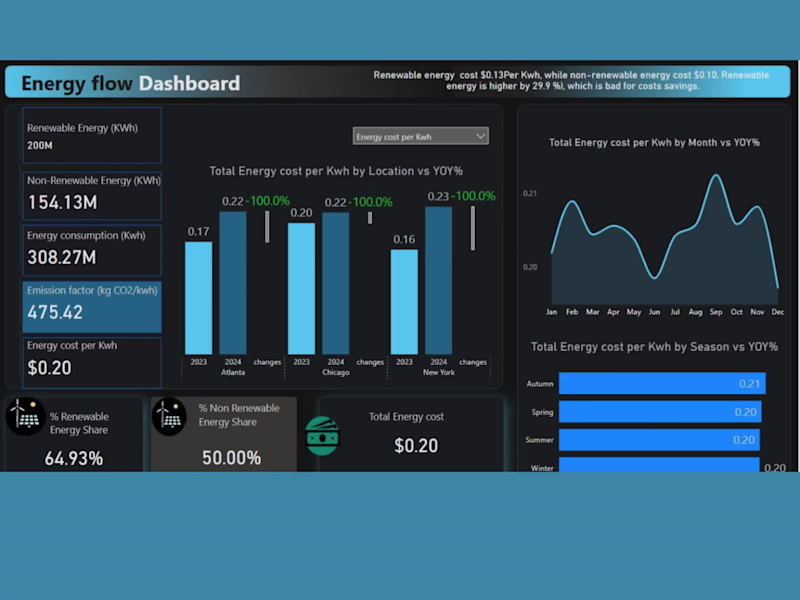
ā” Energy Flow Analysis Dashboard ā Power BI Project This interactive Power BI dashboard provides a comprehensive view of energy generation, consumption, and efficiency across multiple sources and regions. Designed to help energy companies and policymakers make data-driven decisions, it visualizes how energy moves through different stages ā from production to end usage. š Key Insights & Features: Detailed breakdown of energy input, output, and loss percentages. Interactive visuals to track renewable vs. non-renewable energy usage. KPIs highlighting total energy generated, consumed, and saved. Trend charts showing performance over time and by location. This project demonstrates my ability to transform complex energy data into clear, actionable insights using Power BI.
0
51
0
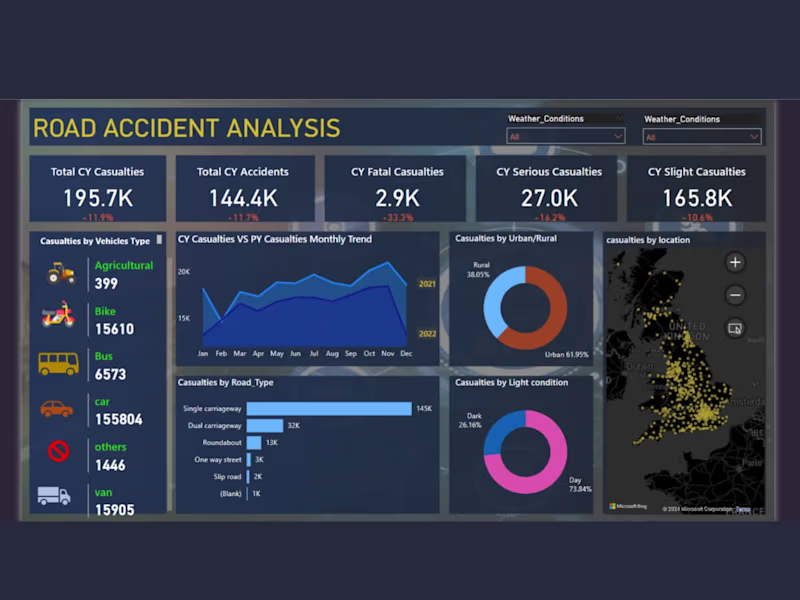
š¦ Road Accident Analysis Dashboard ā Power BI Project This interactive Power BI dashboard provides a detailed analysis of road accidents across multiple regions, helping authorities and businesses identify key risk factors and improve road safety strategies. It offers a visual overview of accident frequency, causes, vehicle types involved, and casualty trends over time. š Key Insights & Features: Trend analysis by accident severity, location, and time period. Interactive filters to compare regions and vehicle categories. Visual KPIs highlighting total accidents, fatalities, and injury rates. Heatmaps showing accident hotspots for targeted interventions. This project demonstrates my ability to clean, model, and visualize large datasets using Power BI. Thanks!
0
68
Microsoft Teams
(1)
Follow
Message
Explore people