



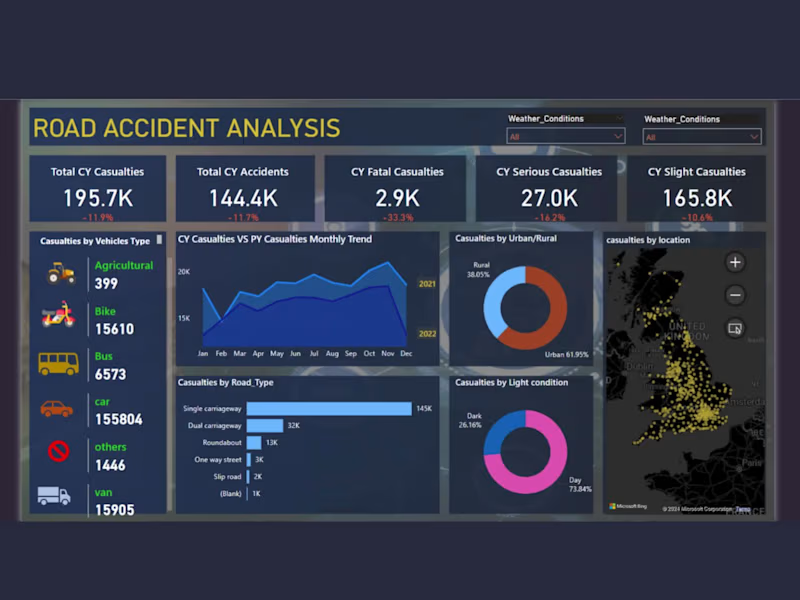
🚦 Road Accident Analysis Dashboard – Power BI Project
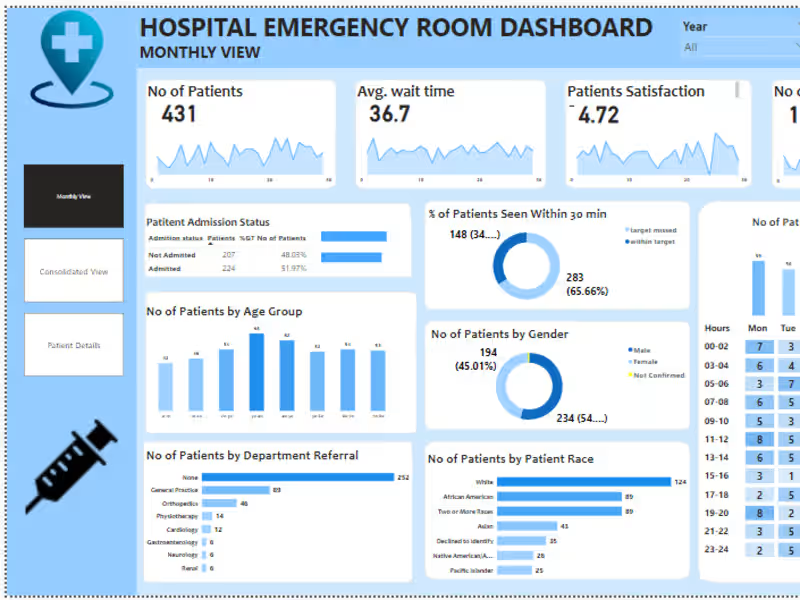
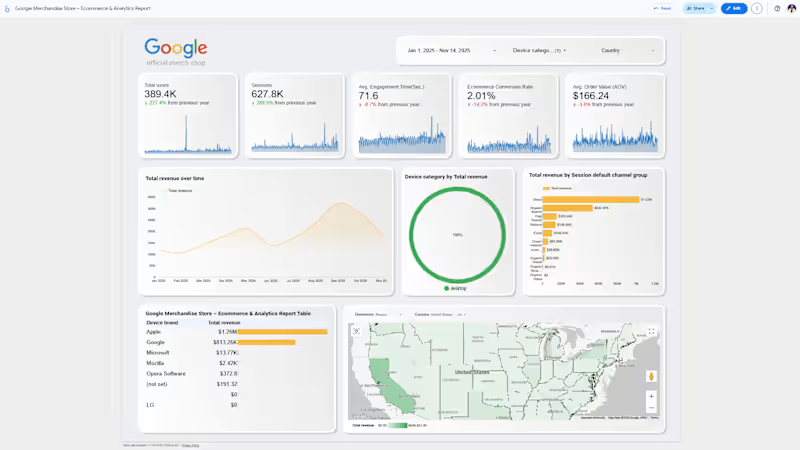
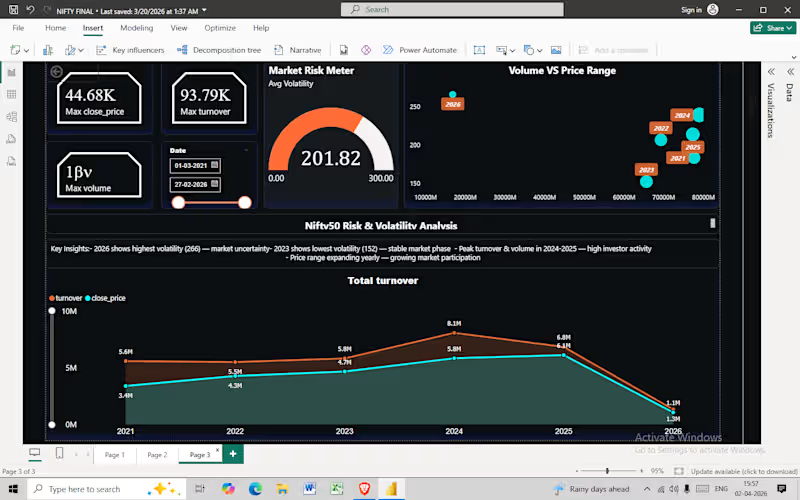
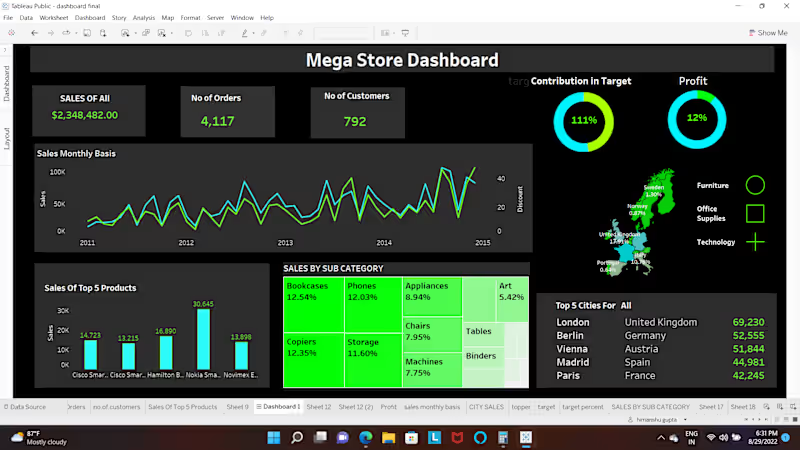
This interactive Power BI dashboard provides a detailed analysis of road accidents across multiple regions, helping authorities and businesses identify key risk factors and improve road safety strategies. It offers a visual overview of accident frequency, causes, vehicle types involved, and casualty trends over time.
🔍 Key Insights & Features:
Trend analysis by accident severity, location, and time period.
Interactive filters to compare regions and vehicle categories.
Visual KPIs highlighting total accidents, fatalities, and injury rates.
Heatmaps showing accident hotspots for targeted interventions.
This project demonstrates my ability to clean, model, and visualize large datasets using Power BI.
Thanks!
0
112