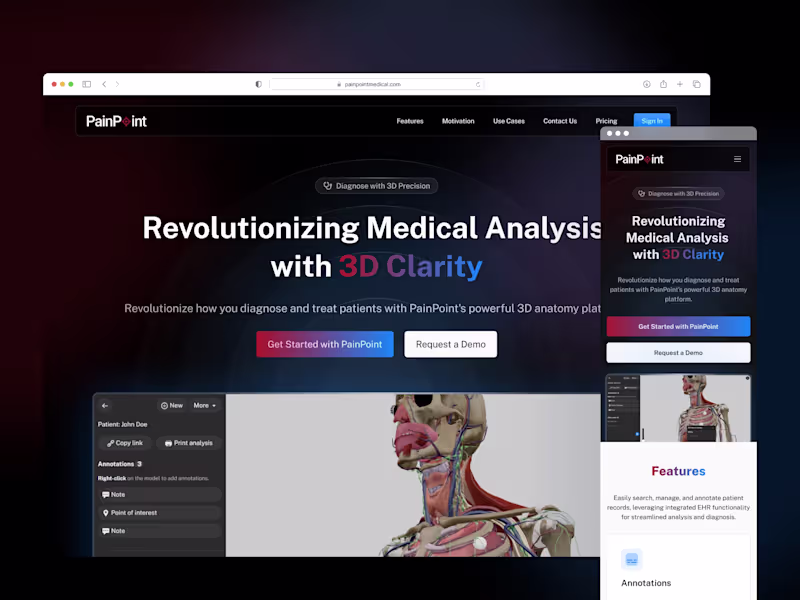
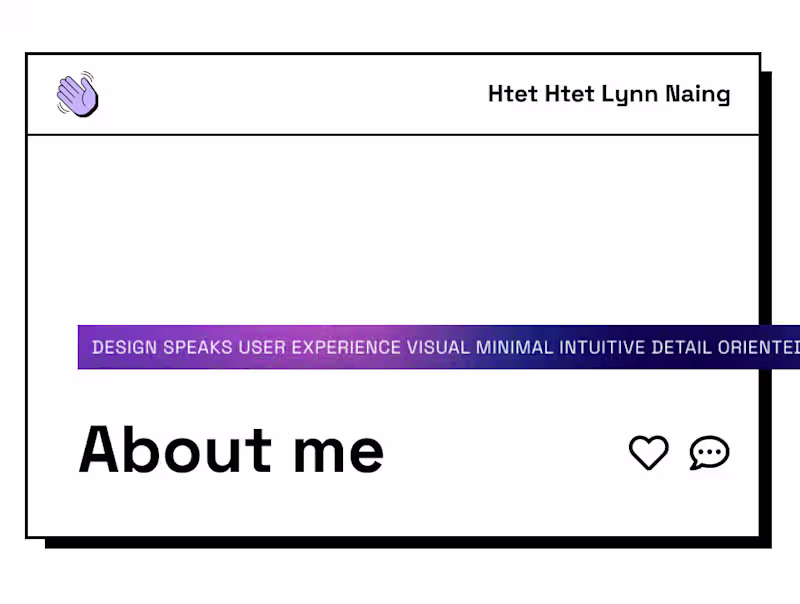
UX Researcher & Illustrator
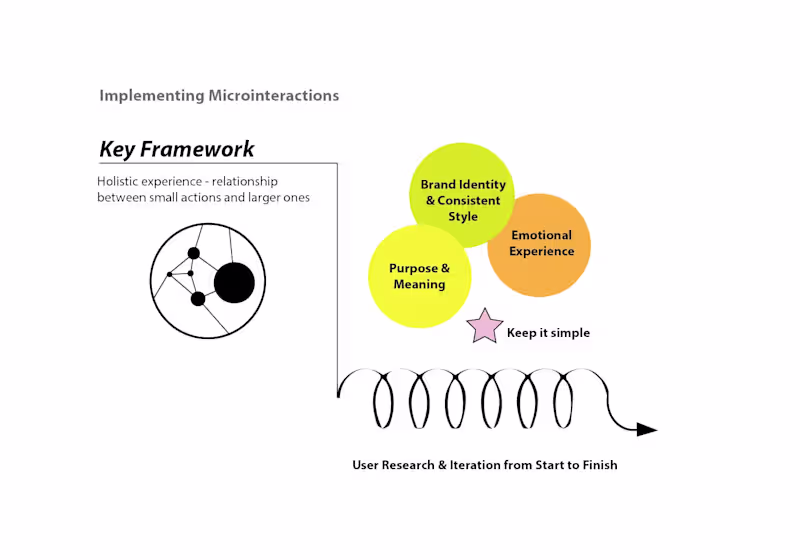
I design intuitive digital product experiences
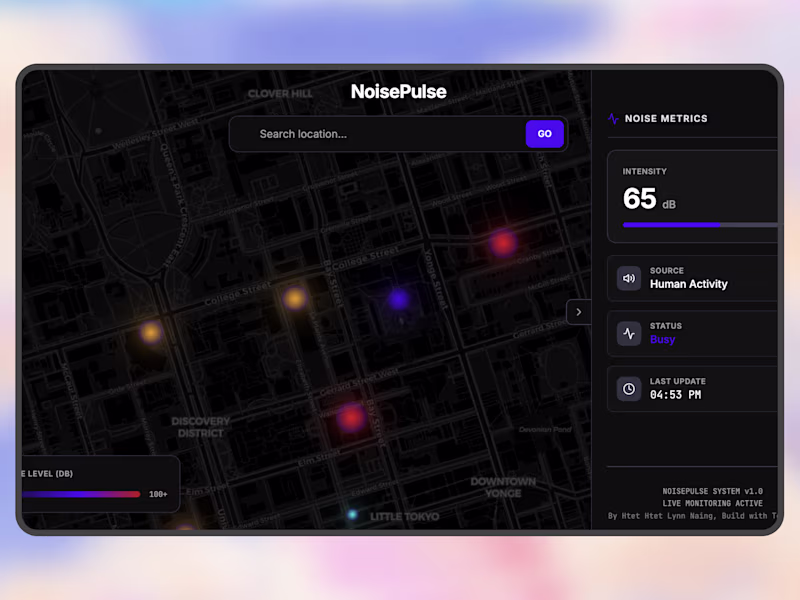

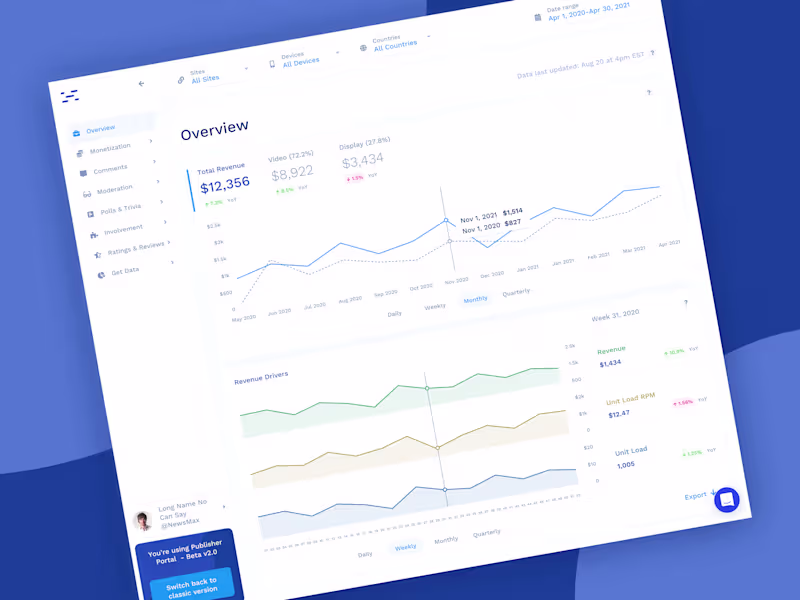
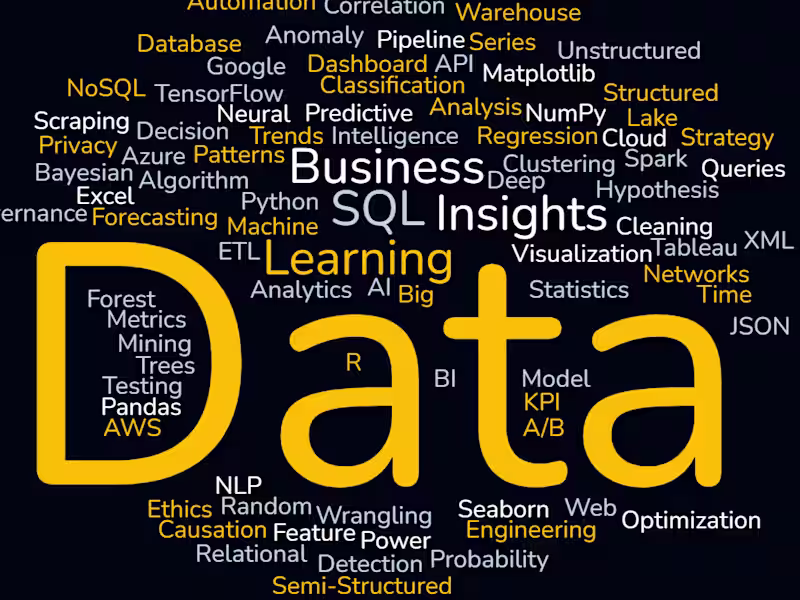
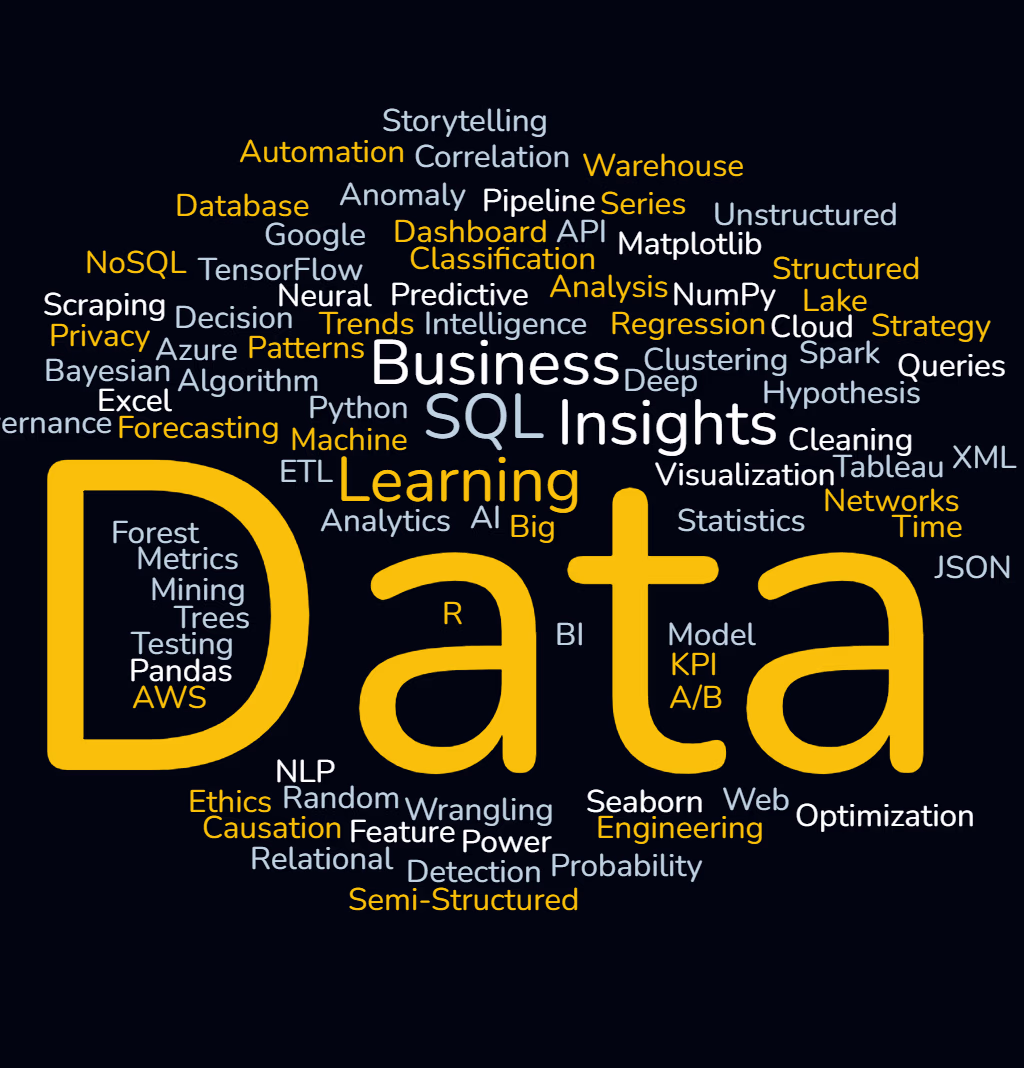
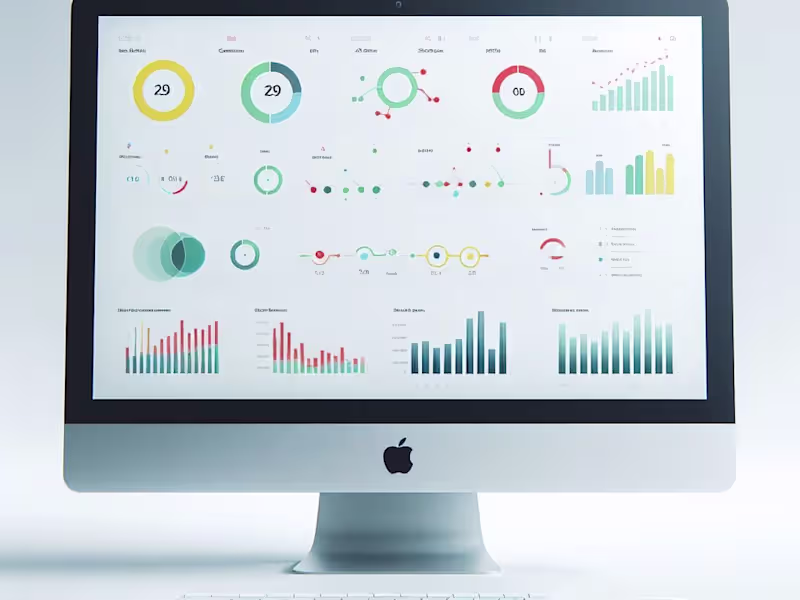
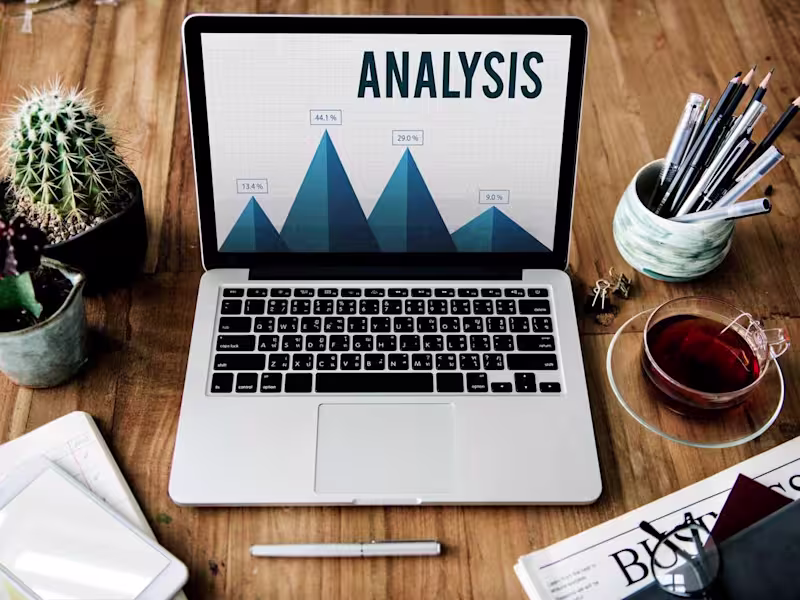
Data Analyst & Multimedia Designer


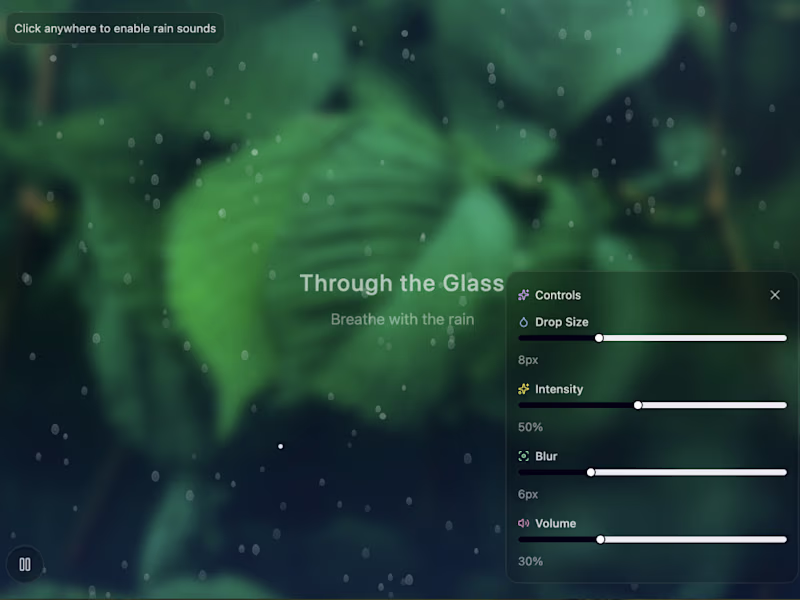
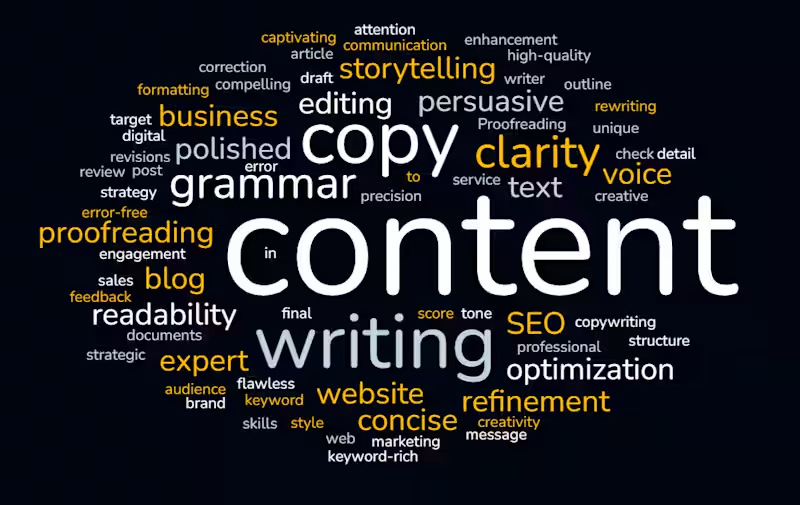
Content Producer, Video Strategist & Motion Graphic Designer


I Convert Your Numbers Into Actionable Business Insights
View more →
AI Developer | Data Scientist | Project Manager
AI Developer | Data Scientist | Project Manager


View more →
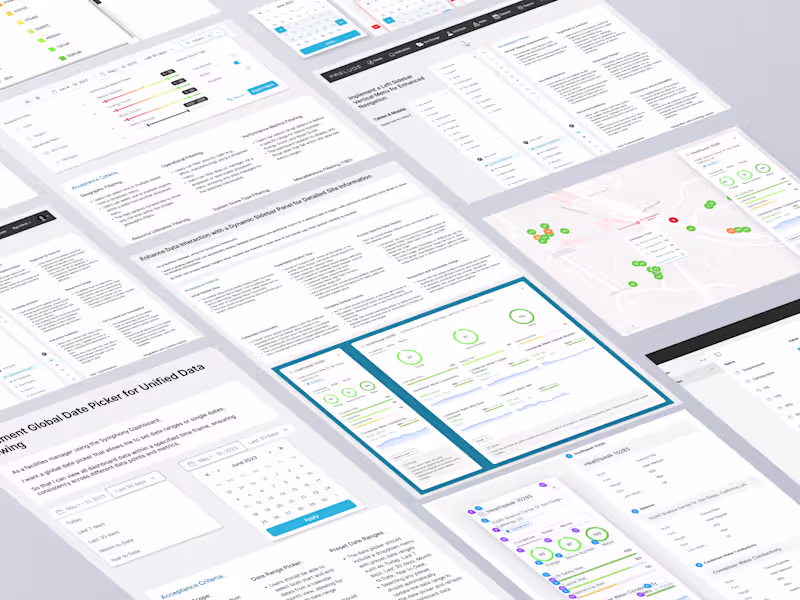
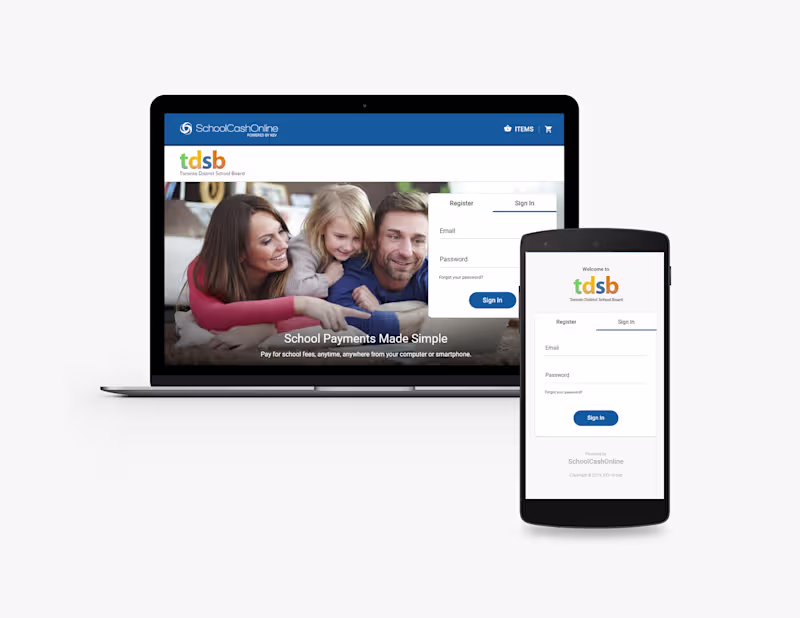
Experienced Product Manager & Data Analyst
Experienced Product Manager & Data Analyst

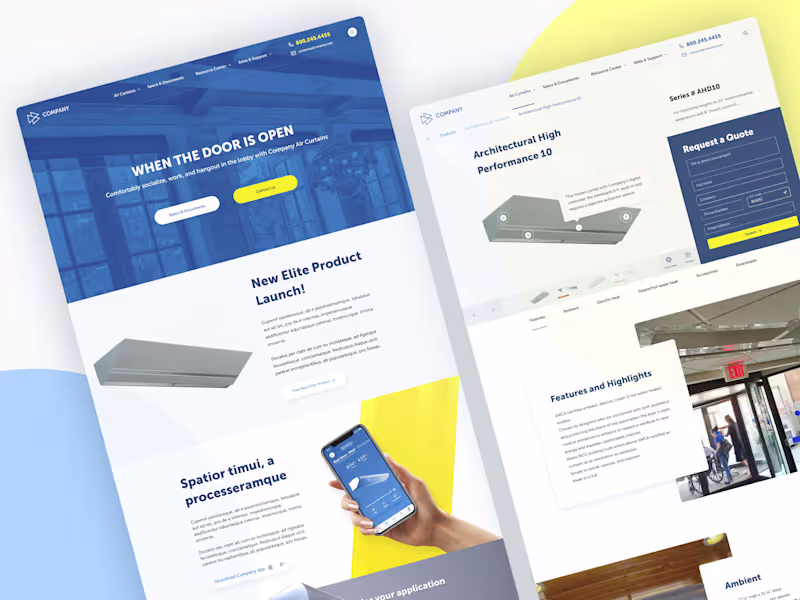
User-Centered Product Designer in Toronto
User-Centered Product Designer in Toronto