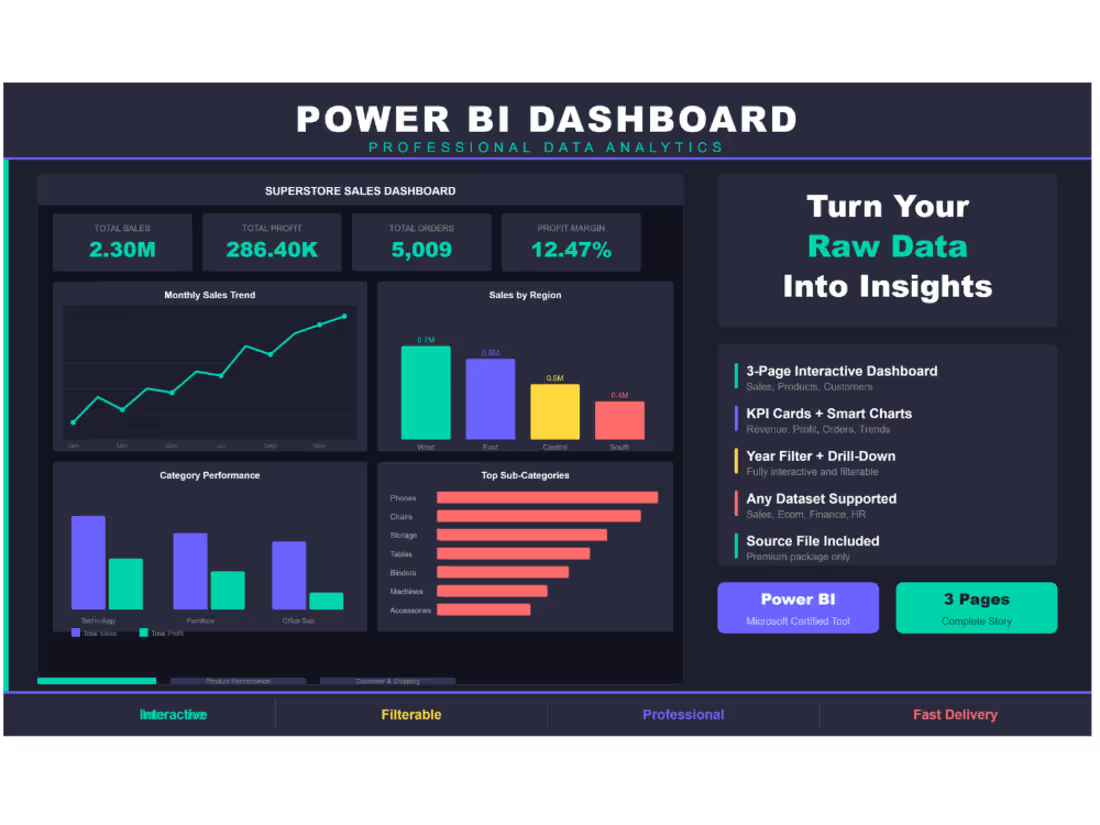
Superstore Sales Dashboard — 3-Page Power BI Report
Built an interactive 3-page Power BI dashboard using
the Superstore Sales dataset (9,994 orders across USA).
Page 1 — Sales Overview: KPI cards, monthly trend,
regional breakdown, category performance.
Page 2 — Product Performance: Top products, category
donut, profit analysis, sales vs profit scatter.
Page 3 — Customer & Shipping: Segment breakdown,
top 10 customers, monthly growth, ship mode distribution.
Tools: Power BI, DAX, Superstore Dataset
Theme: Dark professional with interactive year filter.
0
221
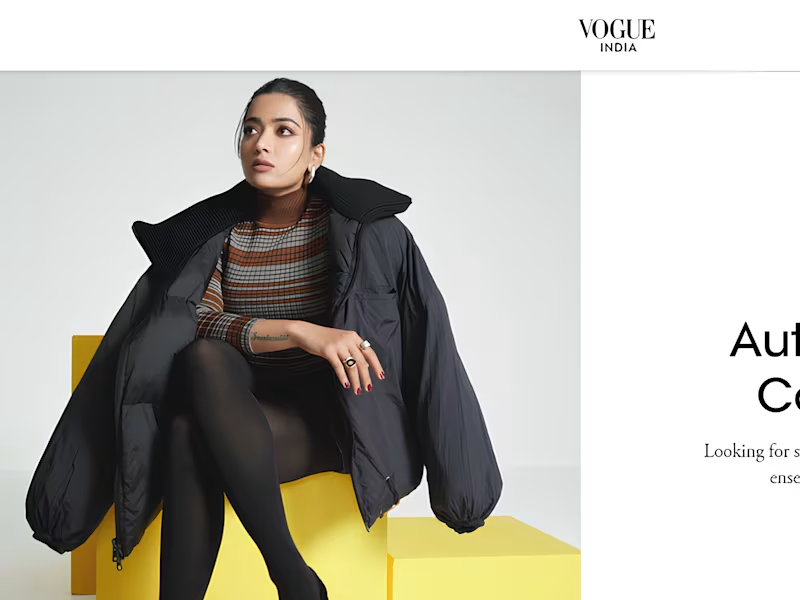
Throwing it back to one of my favorite projects!
Working behind the scenes on the Onitsuka Tiger Autumn/Winter 2024 editorial with Vogue India was a reminder that the most rewarding moments in fashion often happen long before a campaign goes live.
From PR coordination and sourcing the collection to preparing every look for fittings, managing sample movement, supporting the shoot on set, and working closely with both the Vogue India editorial and commercial teams to deliver exclusive campaign assets every detail played a part.
There's something incredibly satisfying about seeing rails of clothing slowly become a finished editorial.
Fashion PR has never just been about placement. It's about coordination, relationships, timing and making the creative process feel seamless.
Still one of those projects I'm proud to have been part of.
#FashionPR #LuxuryMarketing #EditorialProduction #BrandPartnerships #InfluencerMarketing #LuxuryFashion #OnitsukaTiger #VogueIndia
https://www.vogue.in/promotion/onitsuka-tiger-introduces-its-autumn-winter-2024-collection-in-india
0
92

Excited to launch my freelance services! 🚀
I help businesses with FCRA-compliant
data research & background verification reports.
✅ State & county records research
✅ Public records verification
✅ FCRA-compliant reports
✅ 48-hour turnaround
Check out my services 👇
contra.com/s/22EEXX7O
#compliance #dataresearch #FCRA
#backgroundverification #freelancer
1
1
155
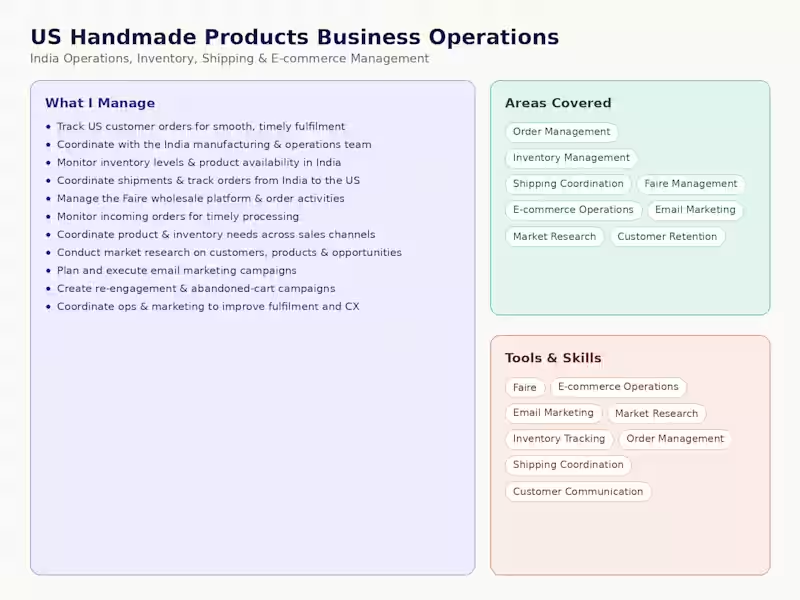
My Freelancing Experience for a USA Based Handmade Products Business
📦 India Operations | 📊 Inventory | 🚚 Shipping | 🛍️ E-commerce | 📧 Marketing
I currently support a US-based handmade products business with manufacturing operations in India, managing the connection between India-side operations and customers/orders in the US.
🔧 What I Manage
📦 Order Management
Manage and track customer orders from the US.
Coordinate order processing and fulfilment with the India team.
Ensure orders are processed accurately and on time.
📊 Inventory Management
Monitor inventory levels and product availability.
Coordinate stock requirements with the manufacturing team.
Maintain visibility of products across sales channels.
🚚 Shipping & Logistics
Coordinate shipments from India to the US.
Track shipments and provide updates on order status.
Help ensure products reach customers within expected timelines.
🛍️ Faire Wholesale Management
Manage the brand's Faire wholesale platform.
Monitor incoming wholesale orders.
Coordinate order processing, fulfilment, and shipping requirements.
📧 Email Marketing
Create and manage email marketing campaigns.
Develop customer re-engagement and abandoned-cart campaigns.
Support customer retention and repeat purchases.
🔍 Market Research
Research market and customer trends.
Identify potential product and business opportunities.
Support decisions around products, customers, and marketing.
🎯 Core Areas
Order Management · Inventory · Logistics · Faire · E-commerce Operations · Email Marketing · Market Research · Customer Retention
💻 Skills & Tools
Faire · E-commerce Operations · Email Marketing · Market Research · Inventory Tracking · Order Management · Shipping Coordination · Customer Communication
🚀 Impact
I act as an operations and e-commerce support partner, helping coordinate the journey from manufacturing in India → inventory → order processing → shipping → US customers, while also supporting the brand's wholesale and marketing activities.
1
260
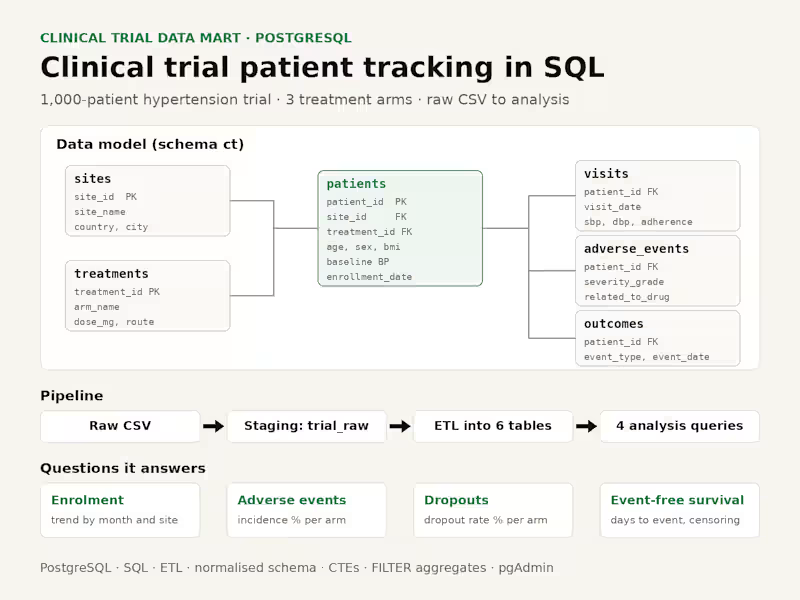
SQL data mart for a 1,000-patient hypertension trial, tracking enrolment, adverse events, dropout and event-free survival.
Highlights
Normalised schema: sites, treatment arms, patients, visits, adverse events, outcomes
SQL analytics for enrolment trends, adverse-event rates by arm, and dropout rates
Survival-style queries for event-free outcomes
0
20
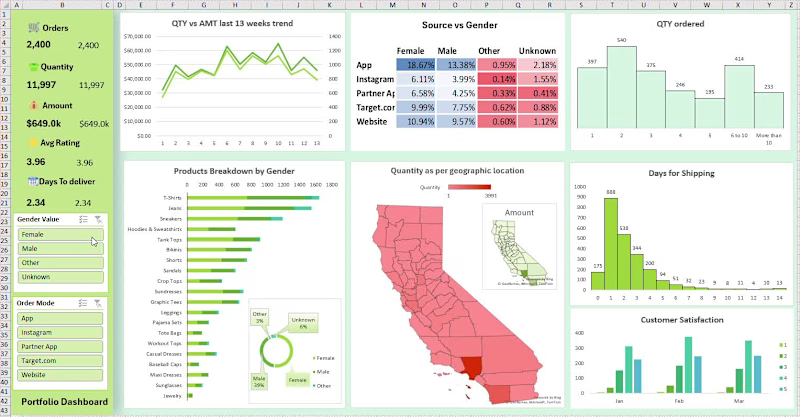
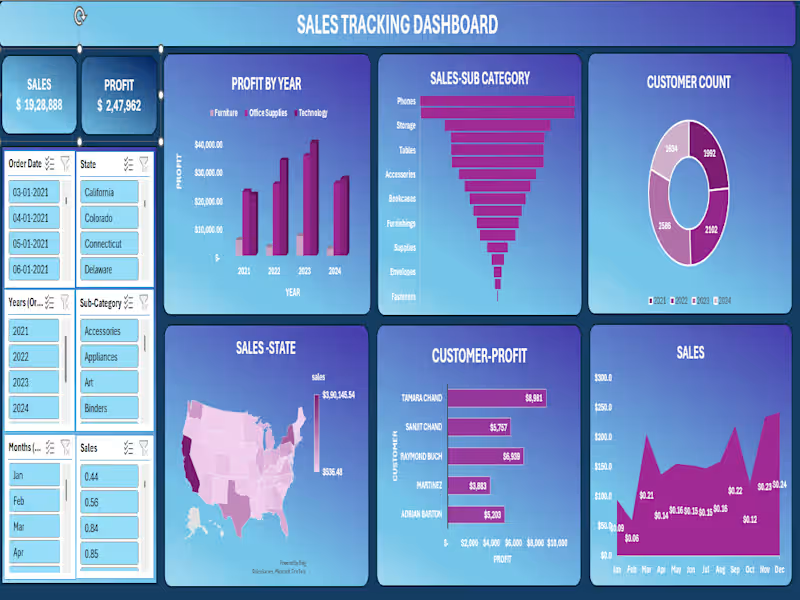
📊 Sales Tracking Dashboard | Excel + Power BI Project
Built an end-to-end interactive Sales Tracking Dashboard covering 2021–2024 across the entire US market.
Top-Line Numbers:
💰 Total Sales: $19,28,888
📈 Total Profit: $2,47,962
👥 Total Customers: 8,314 across all years
What the dashboard reveals:
🏆 Best-selling sub-categories: Phones ($2,79,464) and Chairs ($2,77,058) lead the pack — together accounting for nearly 29% of all sales
📅 Profit growth year-on-year:
→ 2021: $49,556 → 2022: $61,618 → 2023: $81,786 — consistent upward trajectory across Furniture, Office Supplies & Technology
🗺️ Geographic concentration: California dominates at $3,90,145 in sales. New York ($2,46,517) and Texas ($1,51,436) follow. West Virginia sits at the bottom with just $536 — a clear signal for regional strategy review.
📦 Technology drives profit — highest-margin category across all 4 years, despite Furniture holding significant volume
🧾 Seasonal trends: Q4 is king — November ($2,34,013) and December ($2,41,464) are the strongest months. February dips to just $59,640 — opportunity for targeted campaigns.
👤 Top customer by profit: Tamara Chand at $8,981, followed by Raymond Buch ($6,939) and Sanjit Chand ($5,757)
Tools used: Microsoft Excel · Pivot Tables · Power Query · Charts & Slicers · Dashboard Design
This project sharpened my ability to turn raw transactional data into a clean, decision-ready visual — with filters for state, date, year, sub-category, and month.
Open to feedback! 👇
#Excel #DataAnalytics #SalesDashboard #DataVisualization #BusinessIntelligence #MicrosoftExcel #DashboardDesign
0
40
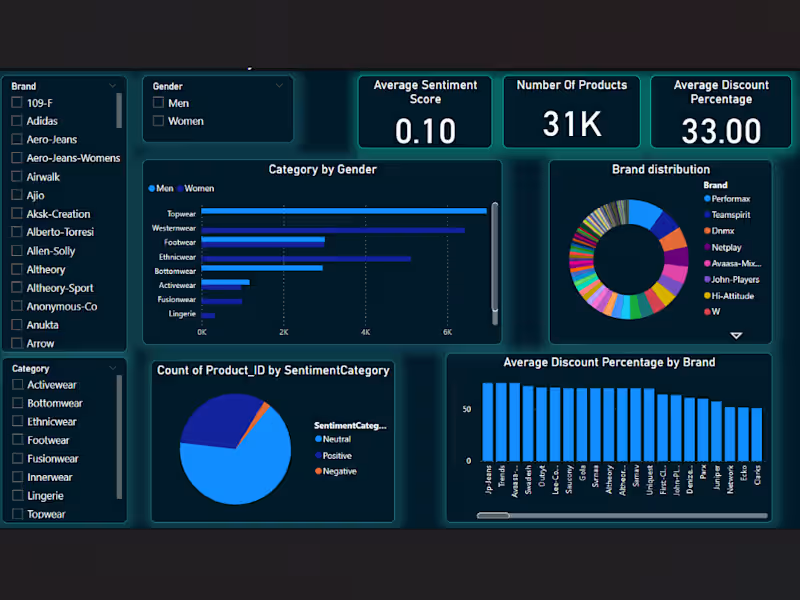
Built an interactive Power BI dashboard to analyze fashion retail data and uncover top-performing brands, customer sentiment, discount trends, and emerging fashion categories. Leveraged Python, SQL, and sentiment analysis to transform raw data into actionable insights for data-driven merchandising and marketing decisions.
0
88
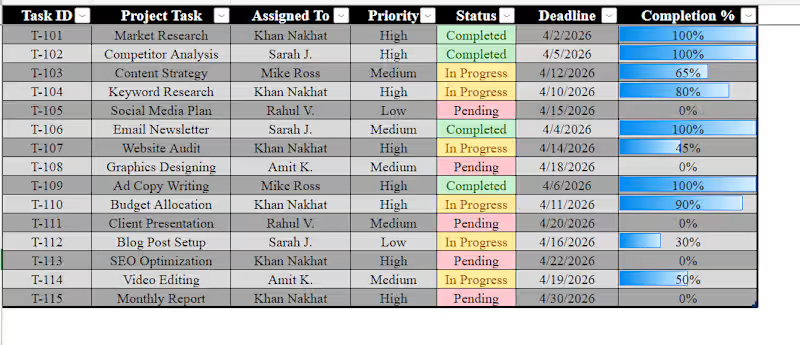
"I just finished building this Dynamic Task Tracker in Excel! 📊
To make project management easier, I’ve added:
✅ Visual Status: Green/Yellow/Red indicators for instant updates.
✅ Progress Bars: Automated bars to show task completion at a glance.
✅ Organized Workflow: Structured by priority and deadlines.
If you need help organizing your business data or creating custom Excel dashboards, I’m available for new projects! 🚀"
2
4
221