The network for creativity
Join 1.25M professional creatives like you
Connect with clients, get discovered, and run your business 100% commission-free
Creatives on Contra have earned over $150M and we are just getting started
Back to feedPost

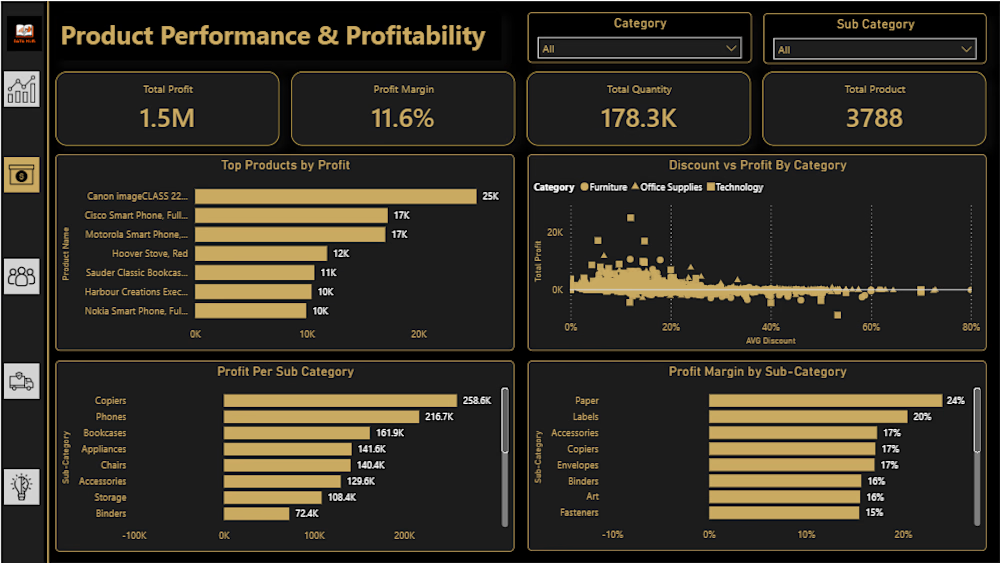
Global Sales & Profitability Analysis Dashboard
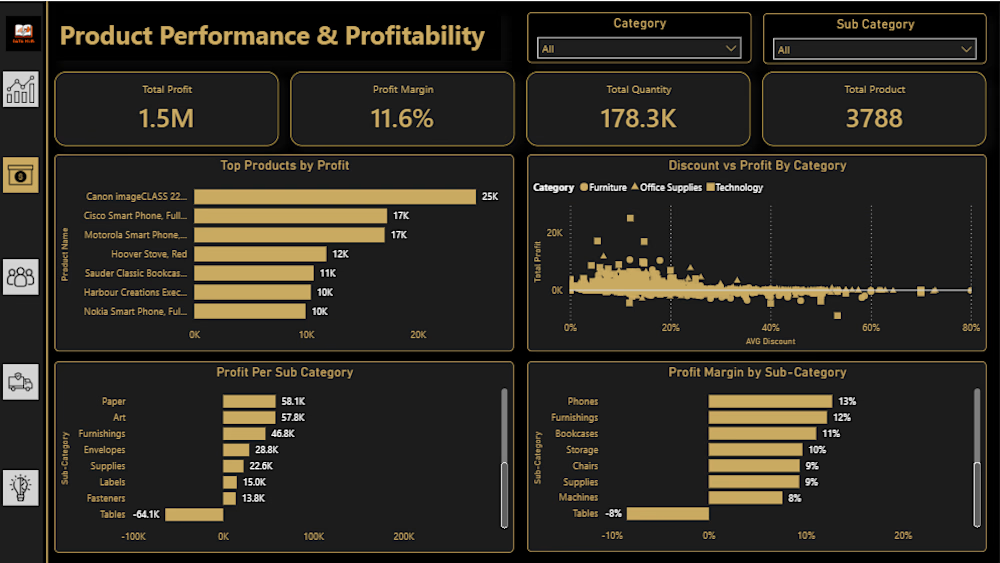
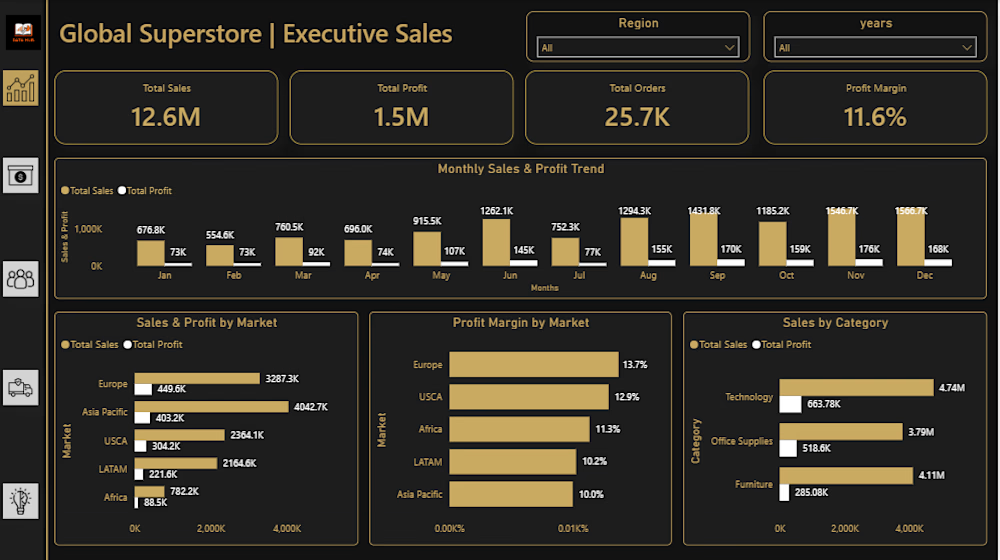
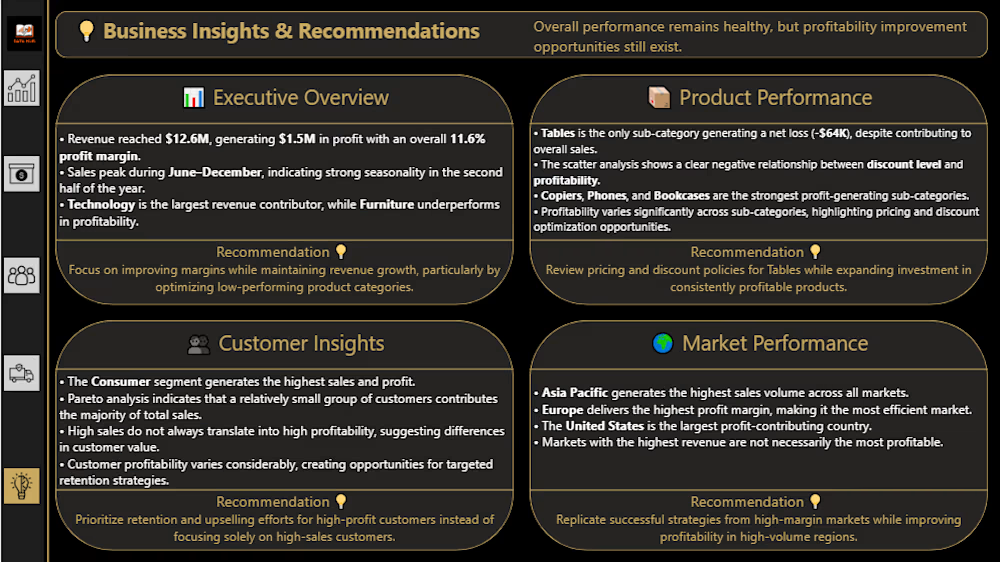
Designed an interactive Business Intelligence dashboard to analyze global retail sales performance, profitability, customer segments, and product categories.
The project involved analyzing approximately 51,000 transaction records to identify business trends, evaluate regional performance, and uncover profitability issues.
Key Analysis Areas:
Sales and Profit Performance
Regional and Market Analysis
Product Category Performance
Customer Segmentation
Discount and Profitability Analysis
Loss-Making Products and Orders
Key Finding:
Identified approximately $64.1K in losses, highlighting opportunities to improve pricing and discount strategies.
Tools & Technologies:
Power BI, DAX, Power Query, Data Modeling, Data Visualization.


The network for creativity
Join 1.25M professional creatives like you
Connect with clients, get discovered, and run your business 100% commission-free
Creatives on Contra have earned over $150M and we are just getting started



Related posts

AI Analytics Dashboard
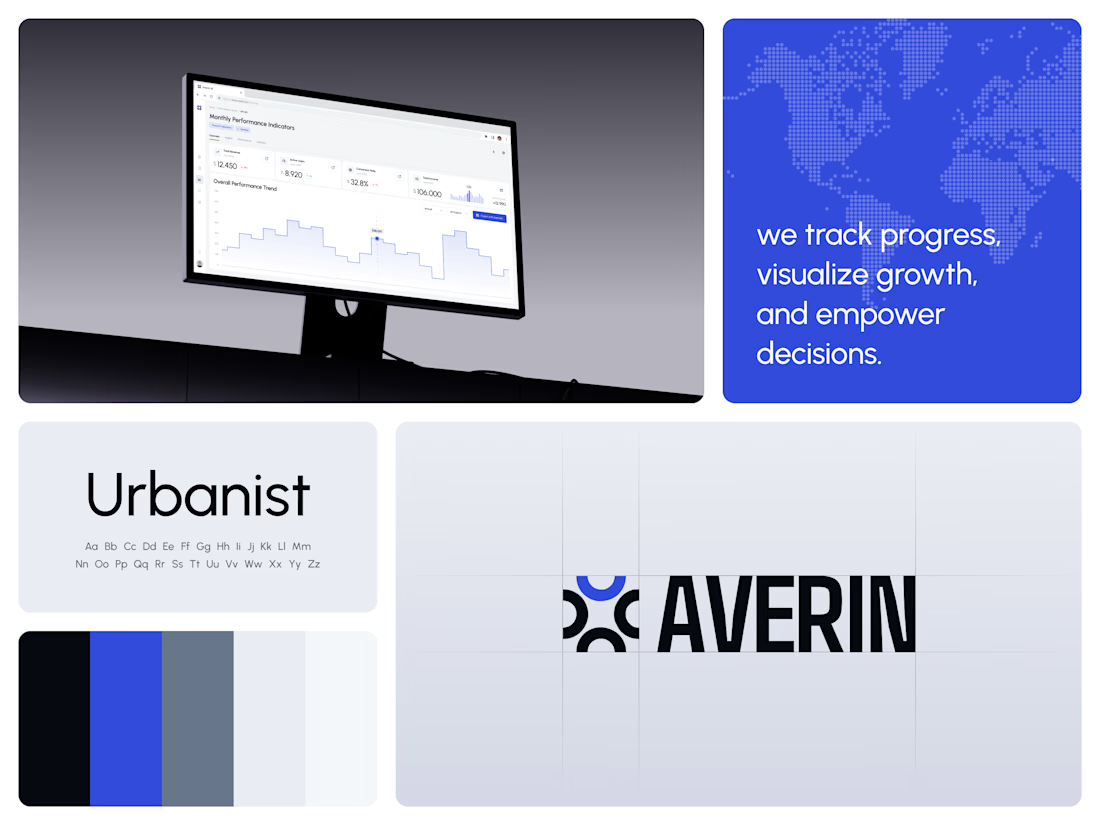
One blue runs from the logo to the chart line.
Revenue, active users, conversion rate and income sit in a row of cards above the trend chart. The cards answer where the numbers stand. The stepped line answers how they got there, holding each period's value until the next, with a tooltip on a dashed guide line for the exact figure.
The identity pairs a four-arc mark with a condensed wordmark, drawn to the same top and bottom lines on the construction grid. The top arc's blue comes back in the slogan tile, the chart line and the main button, so the brand and the product share one accent.
Designed by the Hue & Machine team.
#DashboardDesign #DataVisualization #SaaS #Analytics #AI #WebApp #BrandIdentity #UIDesign #ProductDesign #FigmaDesign



Built a complete SQL Server (T-SQL) data warehouse for a fictional multi-channel, multi-currency retailer (synthetic dataset created for demonstration purposes). Delivered: staging layer loaded from 17 CSV files (~397K rows); one transactional, re-runnable ETL stored procedure that cleans duplicates, mixed date formats and inconsistent labels; a star schema with keys and constraints; reporting views with business rules defined once (net revenue in USD, contribution margin); automated data-quality tests; and 17 analytical queries (cohort retention, RFM segmentation, Pareto/ABC, constant-currency growth, carrier failure alert, inventory health, CAC vs platform claims, budget vs actual). Key insight: marketplace shows 51% gross margin but only 24.5% contribution margin after commission, shipping and refunds.


Developed a comprehensive, 10-page interactive Power BI Executive Dashboard for "Altitude Outfitters" (a multi-channel, multi-currency outdoor retail company operating across 8 countries). The goal was to transform 17 raw, messy tables (~146K order lines) into an automated decision-making tool for leadership.
Key Features & Technical Highlights:
• Data Cleaning & ETL (Power Query): Cleaned dirty data, handled missing values, removed duplicates, and standardized multi-format dates and currencies using custom M-code.
• Data Modeling: Designed a robust Star/Snowflake Schema resolving complex relationships and multi-granularity facts (daily marketing spend, weekly sessions, monthly targets, and order-level sales).
• Advanced DAX: Created 50+ measures including dynamic Currency Conversion (Local to USD + Constant Currency FX Impact), Time Intelligence (YTD, YoY), Contribution Margin Waterfall, and Customer Acquisition Cost (CAC).
• Deep-Dive Analytics: Built Customer Cohort Retention Heatmaps, RFM Segmentation, Pareto (80/20) Analysis, Marketing Funnel, and an Inventory Health Quadrant (Days of Cover vs. Sales Velocity).
• Premium UI/UX Design: Applied a custom JSON dark theme, Field Parameters (dynamic metric switching), 'What-If' scenario sliders for target forecasting, Custom Tooltips, and a seamless Master-Detail drill-through experience using Bookmarks.
(Note: Fictional dataset created for portfolio demonstration purposes).