The network for creativity
Join 1.25M professional creatives like you
Connect with clients, get discovered, and run your business 100% commission-free
Creatives on Contra have earned over $150M and we are just getting started
Back to feedPost

AI Analytics Dashboard
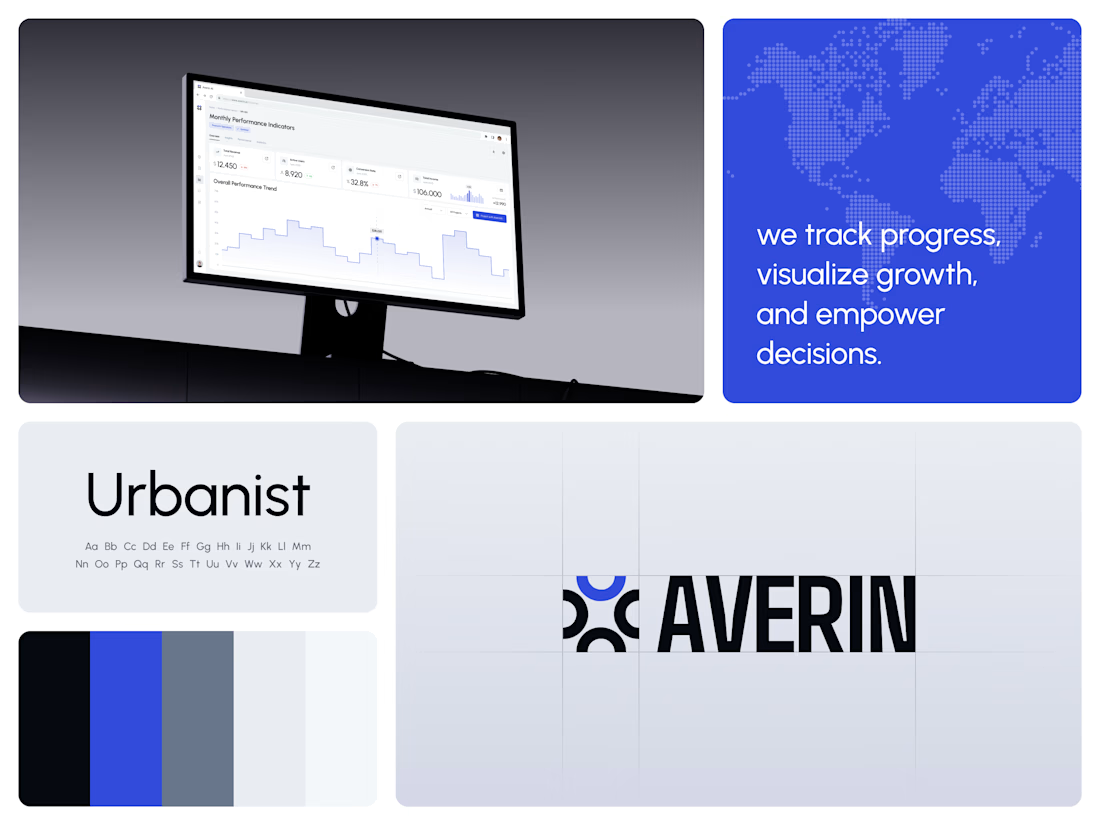
One blue runs from the logo to the chart line.
Revenue, active users, conversion rate and income sit in a row of cards above the trend chart. The cards answer where the numbers stand. The stepped line answers how they got there, holding each period's value until the next, with a tooltip on a dashed guide line for the exact figure.
The identity pairs a four-arc mark with a condensed wordmark, drawn to the same top and bottom lines on the construction grid. The top arc's blue comes back in the slogan tile, the chart line and the main button, so the brand and the product share one accent.
Designed by the Hue & Machine team.
#DashboardDesign #DataVisualization #SaaS #Analytics #AI #WebApp #BrandIdentity #UIDesign #ProductDesign #FigmaDesign



Carrying one blue from the logo through the chart line is such a nice touch. Keeps the whole dashboard calm and focused

Nice work

Love the branding concept really nice (quick question how did you make the desktop mockup)

Brilliant work, Dmytro!

Carrying the same blue from the logo into the chart line and the main button makes the product feel like part of the brand, Dmytro. The stepped line with a dashed guide is a smart choice for period data.

The stepped line is a smart choice for revenue. A smooth curve implies values between periods that never existed, so stepped is more honest for finance data. Carrying the logo's blue into the chart and main button is what makes the dashboard feel like the brand rather than a template.

Great work

Such a refined approach to art direction.

Solid work, very pleasing to look at!


Nice work!
The network for creativity
Join 1.25M professional creatives like you
Connect with clients, get discovered, and run your business 100% commission-free
Creatives on Contra have earned over $150M and we are just getting started


Related posts


The little green dot moving through the grid is so satisfying

The movement flow so naturally, it feels effortless to watch.

Updated the Dreamy effect for Framer, now it’s faster, smoother and more flexible
Grab it here
Really like what I get. If you are web designer, or brand designer would love to hear your feedback
Nice update, Denis. Making it faster and smoother is what matters most when an effect like this ends up on real client sites.