
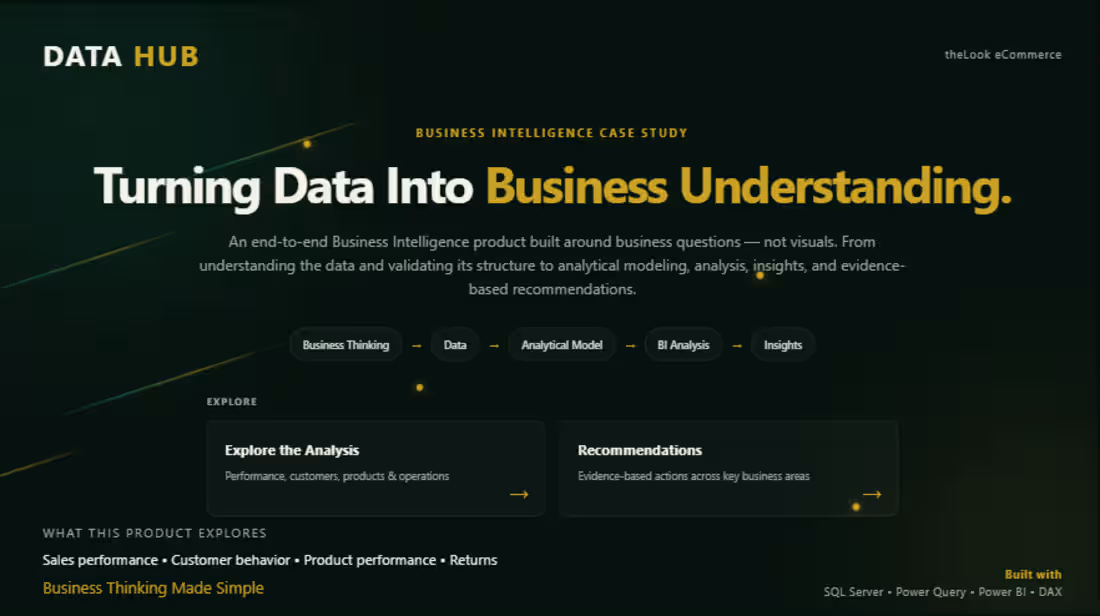
E-commerce Business Intelligence & Customer Behavior Dashboard
Developed an E-commerce Business Intelligence solution to analyze customer behavior, purchasing patterns, sales performance, and user engagement.
The analysis covered a large dataset containing:
100,000+ Users
124,923 Orders
1,048,575 Events
Key Analysis Areas:
Customer Acquisition and Engagement
Customer Retention and Repeat Purchases
Sales and Order Performance
Customer Behavior Analysis
User Session Data Quality
E-commerce Funnel Analysis
Key Findings:
Approximately 69.1% of user session records contained NULL user identifiers.
Repeat customers represented approximately 37.5% of buyers.
Repeat customers contributed approximately 60.1% of total sales.
Tools & Technologies:
SQL, BigQuery, Power BI, DAX, Data Modeling, Business Intelligence.
0
13
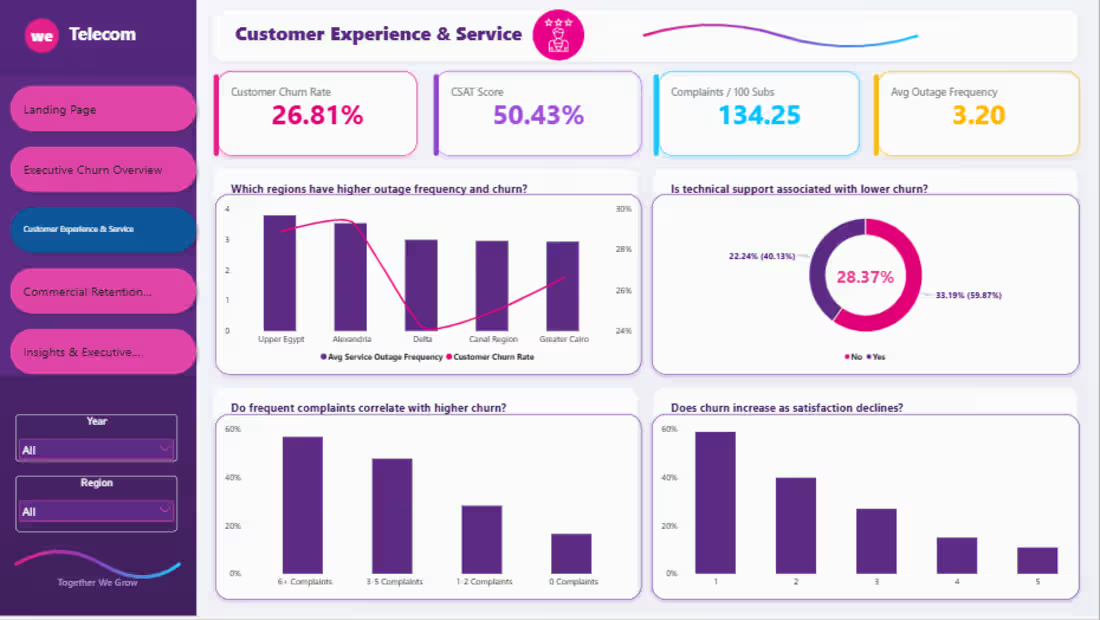
Telecommunications Customer Churn Analysis & BI Dashboard
Contributed to the development of an interactive Business Intelligence solution for analyzing customer churn in the telecommunications industry.
The project covered 8,000 customer records and focused on understanding customer attrition, satisfaction, and key business performance indicators.
My Contributions:
Created DAX measures for business KPIs.
Designed the dashboard Landing Page.
Designed Page 1 and Page 3.
Selected and configured visualizations to communicate analytical findings effectively.
Key Analysis Areas:
Customer Churn Rate
Customer Satisfaction (CSAT)
Customer Segmentation
Churn Trends and Patterns
Business KPI Monitoring
Key Findings:
Total churned customers: 2,145.
Overall churn rate: 26.81%.
Customer satisfaction score: 50.43%.
Tools & Technologies:
Power BI, DAX, Data Visualization, Business Intelligence.
Note: Data modeling and a date-related adjustment were handled by another team member.
0
14
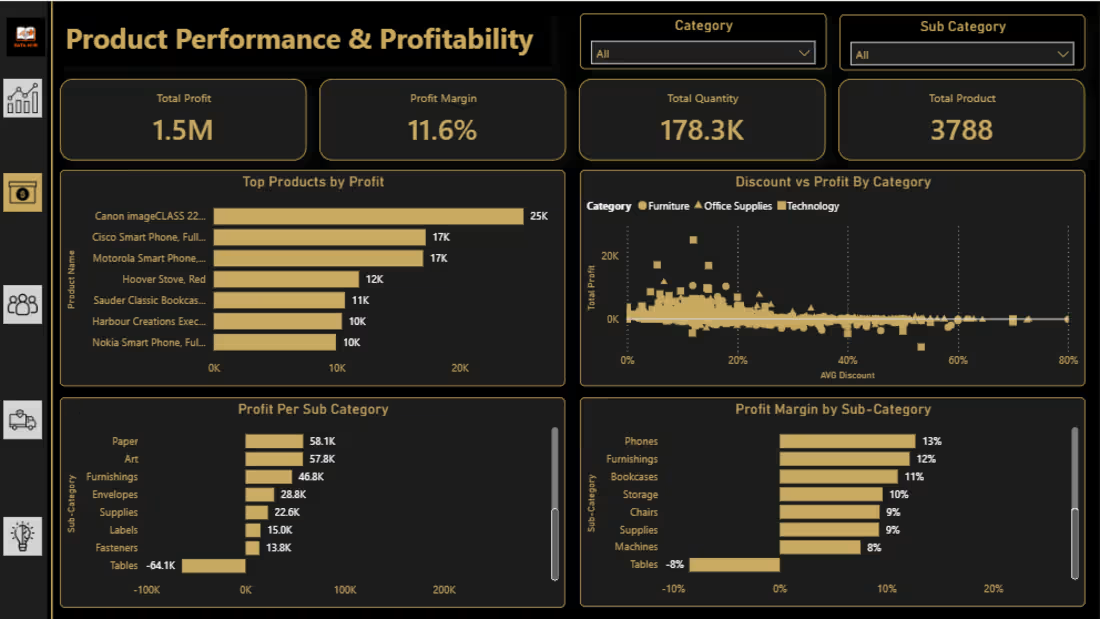
Global Sales & Profitability Analysis Dashboard
Designed an interactive Business Intelligence dashboard to analyze global retail sales performance, profitability, customer segments, and product categories.
The project involved analyzing approximately 51,000 transaction records to identify business trends, evaluate regional performance, and uncover profitability issues.
Key Analysis Areas:
Sales and Profit Performance
Regional and Market Analysis
Product Category Performance
Customer Segmentation
Discount and Profitability Analysis
Loss-Making Products and Orders
Key Finding:
Identified approximately $64.1K in losses, highlighting opportunities to improve pricing and discount strategies.
Tools & Technologies:
Power BI, DAX, Power Query, Data Modeling, Data Visualization.
0
12
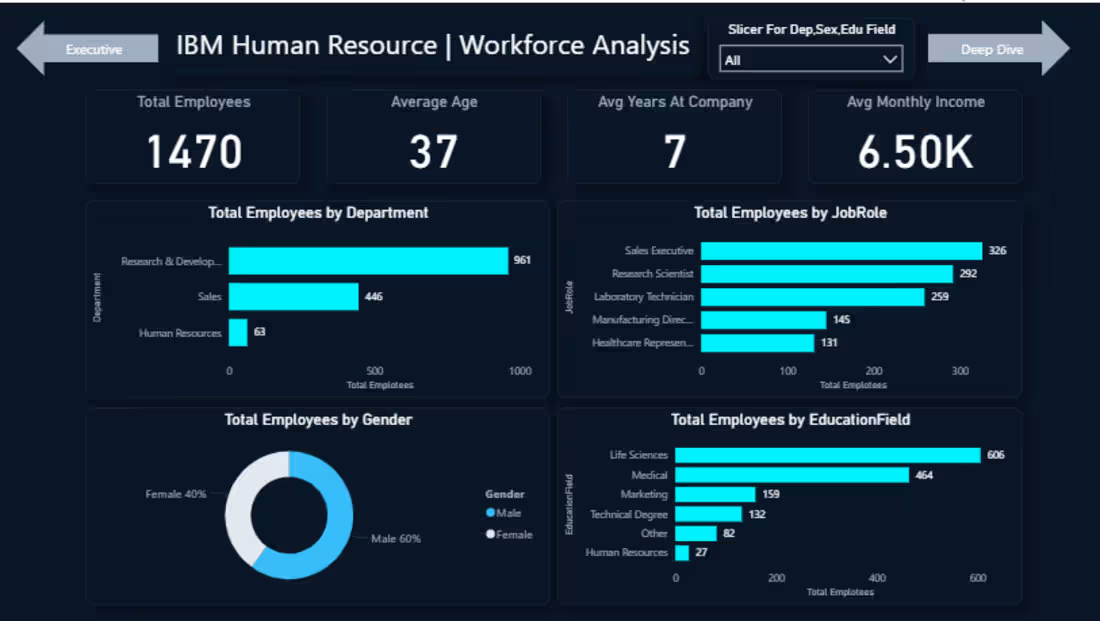
HR Analytics & Employee Attrition Analysis Dashboard
Developed an interactive HR Analytics dashboard using Power BI to analyze employee data, identify workforce trends, and uncover key factors contributing to employee attrition.
The project involved analyzing 1,470 employee records, performing data cleaning, creating DAX measures, and designing interactive visualizations.
Key Analysis Areas:
Employee Attrition Analysis
Workforce Demographics
Job Satisfaction and Employee Performance
Overtime and Attrition Relationships
Departmental and Job Role Analysis
Key Findings:
Overall employee attrition rate of approximately 16%.
Employees working overtime showed significantly higher attrition risk.
Tools & Technologies:
Power BI, DAX, Power Query, Data Cleaning, Data Visualization.
0
18