The network for creativity
Join 1.25M professional creatives like you
Connect with clients, get discovered, and run your business 100% commission-free
Creatives on Contra have earned over $150M and we are just getting started
Back to feedPost

More KPIs won’t fix an unclear business question.
Self-initiated fictional concept. The e-commerce business and dataset are fictional and were created for portfolio demonstration. No real company data or real-world business results are represented.
For an e-commerce team, “How are sales doing?” needs more than a revenue total. What period are we looking at? Which orders count? What should we investigate next?
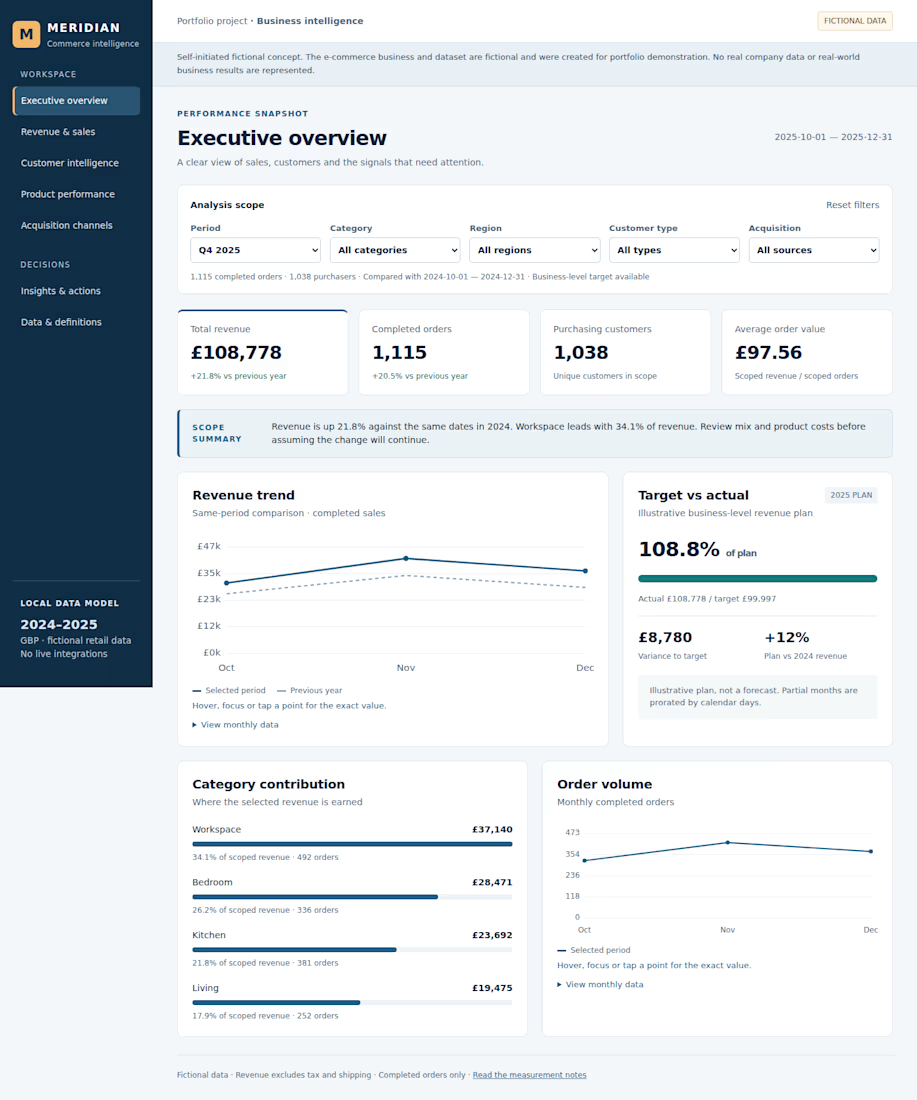
In my BI dashboard concept, I kept the executive view focused on four core measures: revenue, completed orders, purchasing customers and average order value.
The important decisions sit behind those cards:
• Revenue uses completed order lines after discounts; cancellations and full refunds are excluded.
• Orders and purchasers are distinct counts. AOV is revenue divided by completed orders—not an average of monthly averages.
• Filters use a shared scope, and year-over-year comparisons use the same dates and dimension filters.
• Findings lead to investigation prompts, not promises. A strong category is a reason to examine product mix and costs before increasing inventory.
My starting point when scoping a dashboard: agree on the decision, define the measures, then choose the visuals. That helps a small team understand what the numbers can—and cannot—tell them.
Which is harder in your sales reporting: agreeing on the numbers or deciding what to investigate next?
Explore the concept and its measurement notes:
https://contra.com/p/3mBQqBko-e-commerce-business-intelligence-and-performance-dashboard?r=bartholomew_frank_ire1a0gt
The network for creativity
Join 1.25M professional creatives like you
Connect with clients, get discovered, and run your business 100% commission-free
Creatives on Contra have earned over $150M and we are just getting started





Related posts

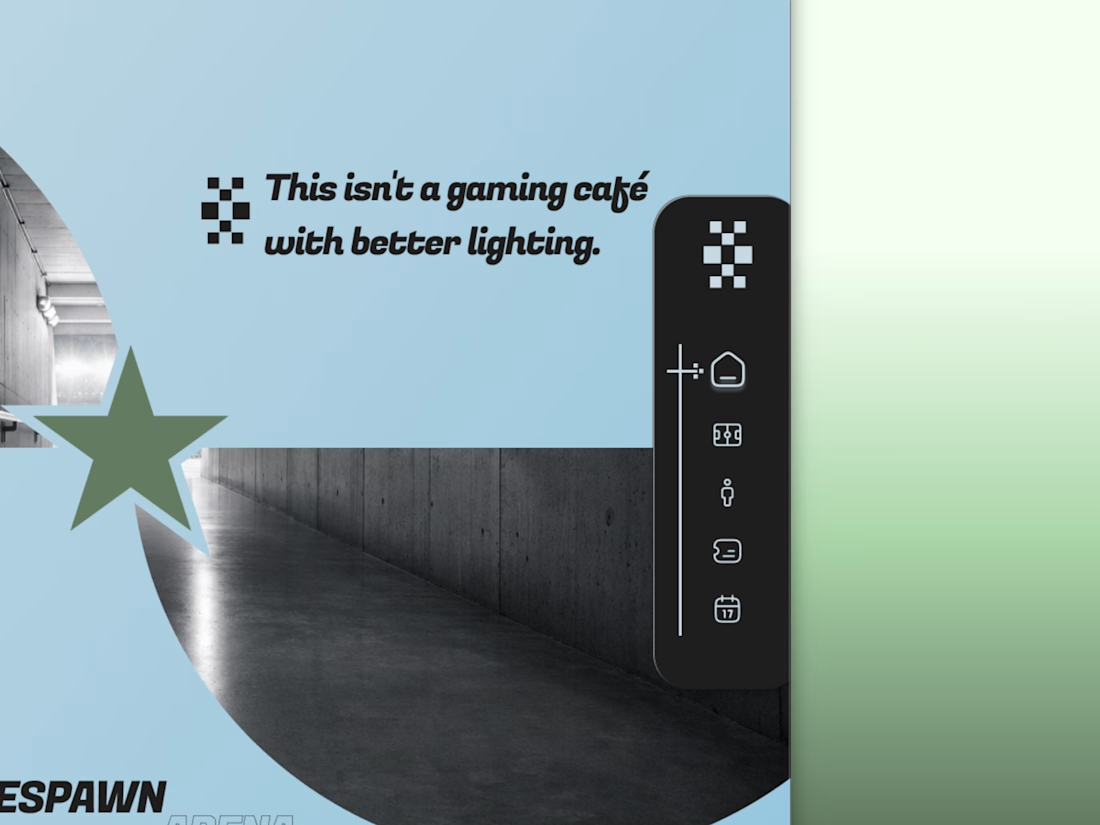
Every esports brand reaches for neon and a mascot.
RESPAWN ARENA reaches for a scoreboard.
Case study on the stadium-grade identity — typography, system, the whole build — dropping soon.



Very nice


Incredible work