E-commerce Business Intelligence & Performance Dashboard

Batholomew Frank


Self-initiated fictional concept. The e-commerce business and dataset are fictional and were created for portfolio demonstration. No real company data or real-world business results are represented.
Role: Data Analyst & Business Intelligence Designer
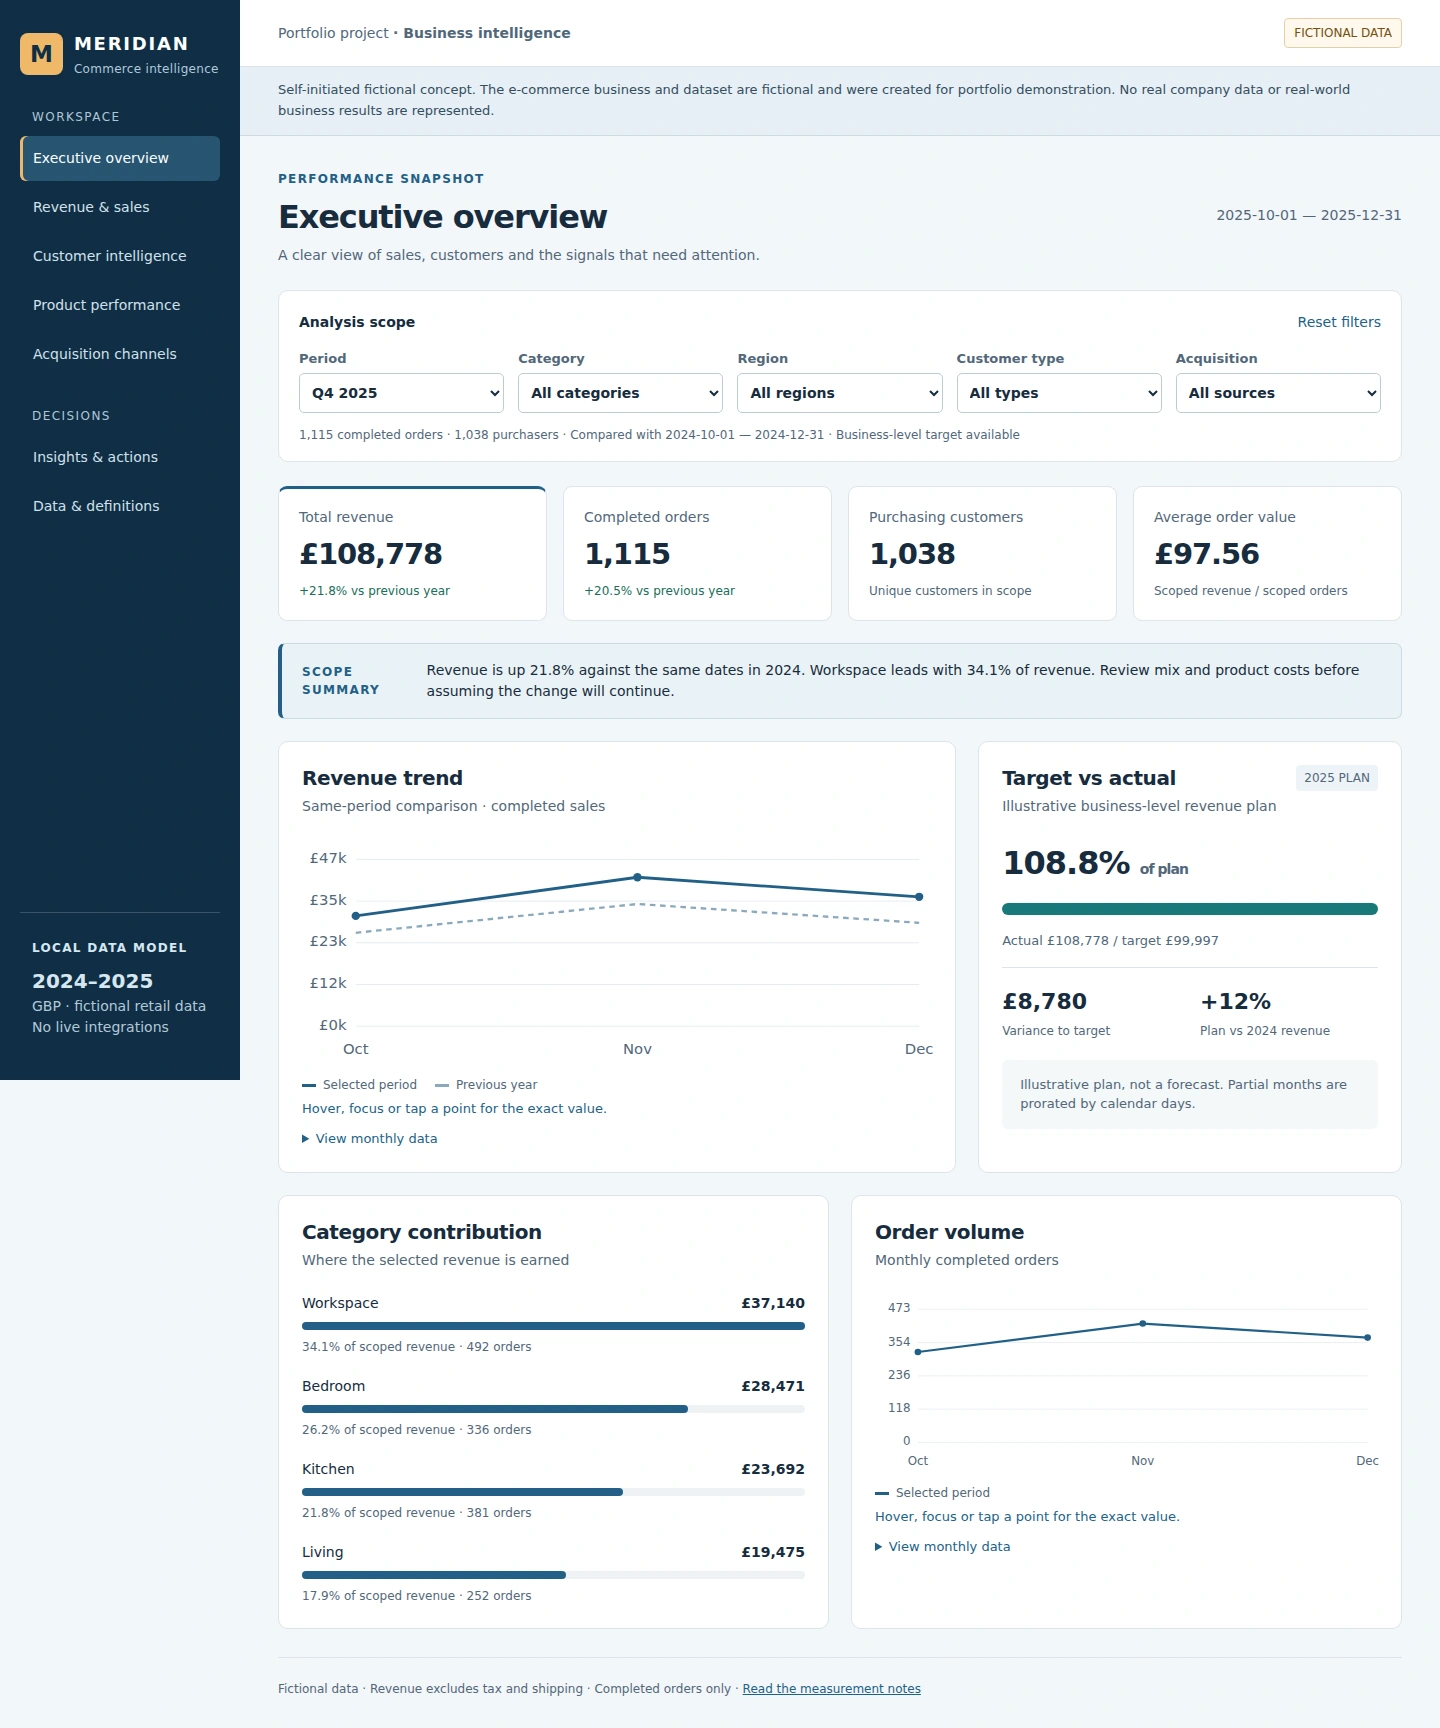
Executive overview: calculated sales KPIs, same-period comparisons and an illustrative target from fictional data.
Project overview
A standalone business intelligence dashboard exploring how a small e-commerce team could turn fragmented order records into a consistent view of sales, customers and products. The demonstration uses a reproducible fictional dataset and makes its definitions, comparisons and limitations visible alongside the analysis.
Problem
Founders and operators need to understand what is driving sales, which categories require attention, how customer purchasing differs and where revenue is concentrated. Without shared definitions, attractive charts can still lead to inconsistent interpretations of revenue, orders and customer behaviour.
Approach
I structured the project around a management decision workflow: define the scope, reconcile the measures, compare performance, inspect the underlying contribution and identify the next question to investigate. A common calculation layer keeps filters, KPIs, charts and decision cards aligned.
Data
The fictional home-and-lifestyle retailer has 6,760 placed orders and 9,463 order lines over 2024–2025, covering 12 products, four categories and five UK regions. Completed orders, cancellations and full refunds are explicitly separated. Discounts, product costs, customer purchase history and first-order acquisition source support the analysis.
The data is generated locally using documented assumptions. It intentionally contains seasonality and a changing category mix; those assumptions are not presented as evidence about a real market.
Analysis
Revenue is calculated from completed order lines after discounts. Orders and purchasers are distinct counts, and AOV is calculated from aggregate revenue and orders. Same-period previous-year comparisons use identical dimension filters. Gross margin includes product costs only, while customer value describes selected-period spending rather than predictive lifetime value.
Category-scoped AOV uses matching line revenue, not entire baskets. Targets are illustrative business-level plans and are suppressed when the selected dimensions lack an allocated target. Missing comparative history is labelled unavailable.
Dashboard
Seven views cover executive performance, revenue and sales, customers, products, acquisition sources, insights and measurement definitions. Users can change dates and dimensions, inspect exact chart values, rank products, open a product detail and reset the analysis. Mobile layouts reorganise cards, keep filters accessible and contain table scrolling within the relevant component.
Insights
In the fictional Q4 2025 scope, Workspace contributes 34.1% of revenue and has the strongest category comparison at +69.5% year over year. Living shows a −1.2% comparison, while the leading product contributes 18.7% of revenue. These figures are calculated from the sample records and change with the filter scope.
The decision center pairs each finding with its implication and a bounded investigation prompt. It does not turn correlation into a causal explanation or promise improved performance.
Recommendations
Consider examining product mix, margin and stock availability in the strongest category before committing more inventory. Investigate the weaker category's pricing, returns and stock constraints before attributing its change to demand. Review supply continuity for the leading product, fulfilment economics by region and longer purchase histories before making retention decisions.
These are evidence-based questions for management, not guaranteed outcomes.
Implementation and validation
The product runs with HTML5, CSS3 and JavaScript, using local data and SVG charts. It needs no backend, API key, database account or production integration. Calculation checks reconcile against independent Python references; browser QA covers coordinated filters, routes, responsive layouts, keyboard interactions, empty/error states and reload behaviour.
The deliverable demonstrates a traceable analytical workflow and an interactive decision interface. It does not claim realised revenue, conversion or client performance gains.
Limitations
This is a frontend portfolio demonstration with fictional data. There are no external data connections, production integrations or backend. No traffic or advertising spend is available, so the project makes no conversion, CAC, ROAS or marketing ROI claim. Gross profit is not net profit. Purchase history is limited, refunds are simplified and observed spend is not predictive customer lifetime value.
Mobile captures are responsive browser captures. No physical Android testing, accessibility certification, client engagement or real business result is claimed.
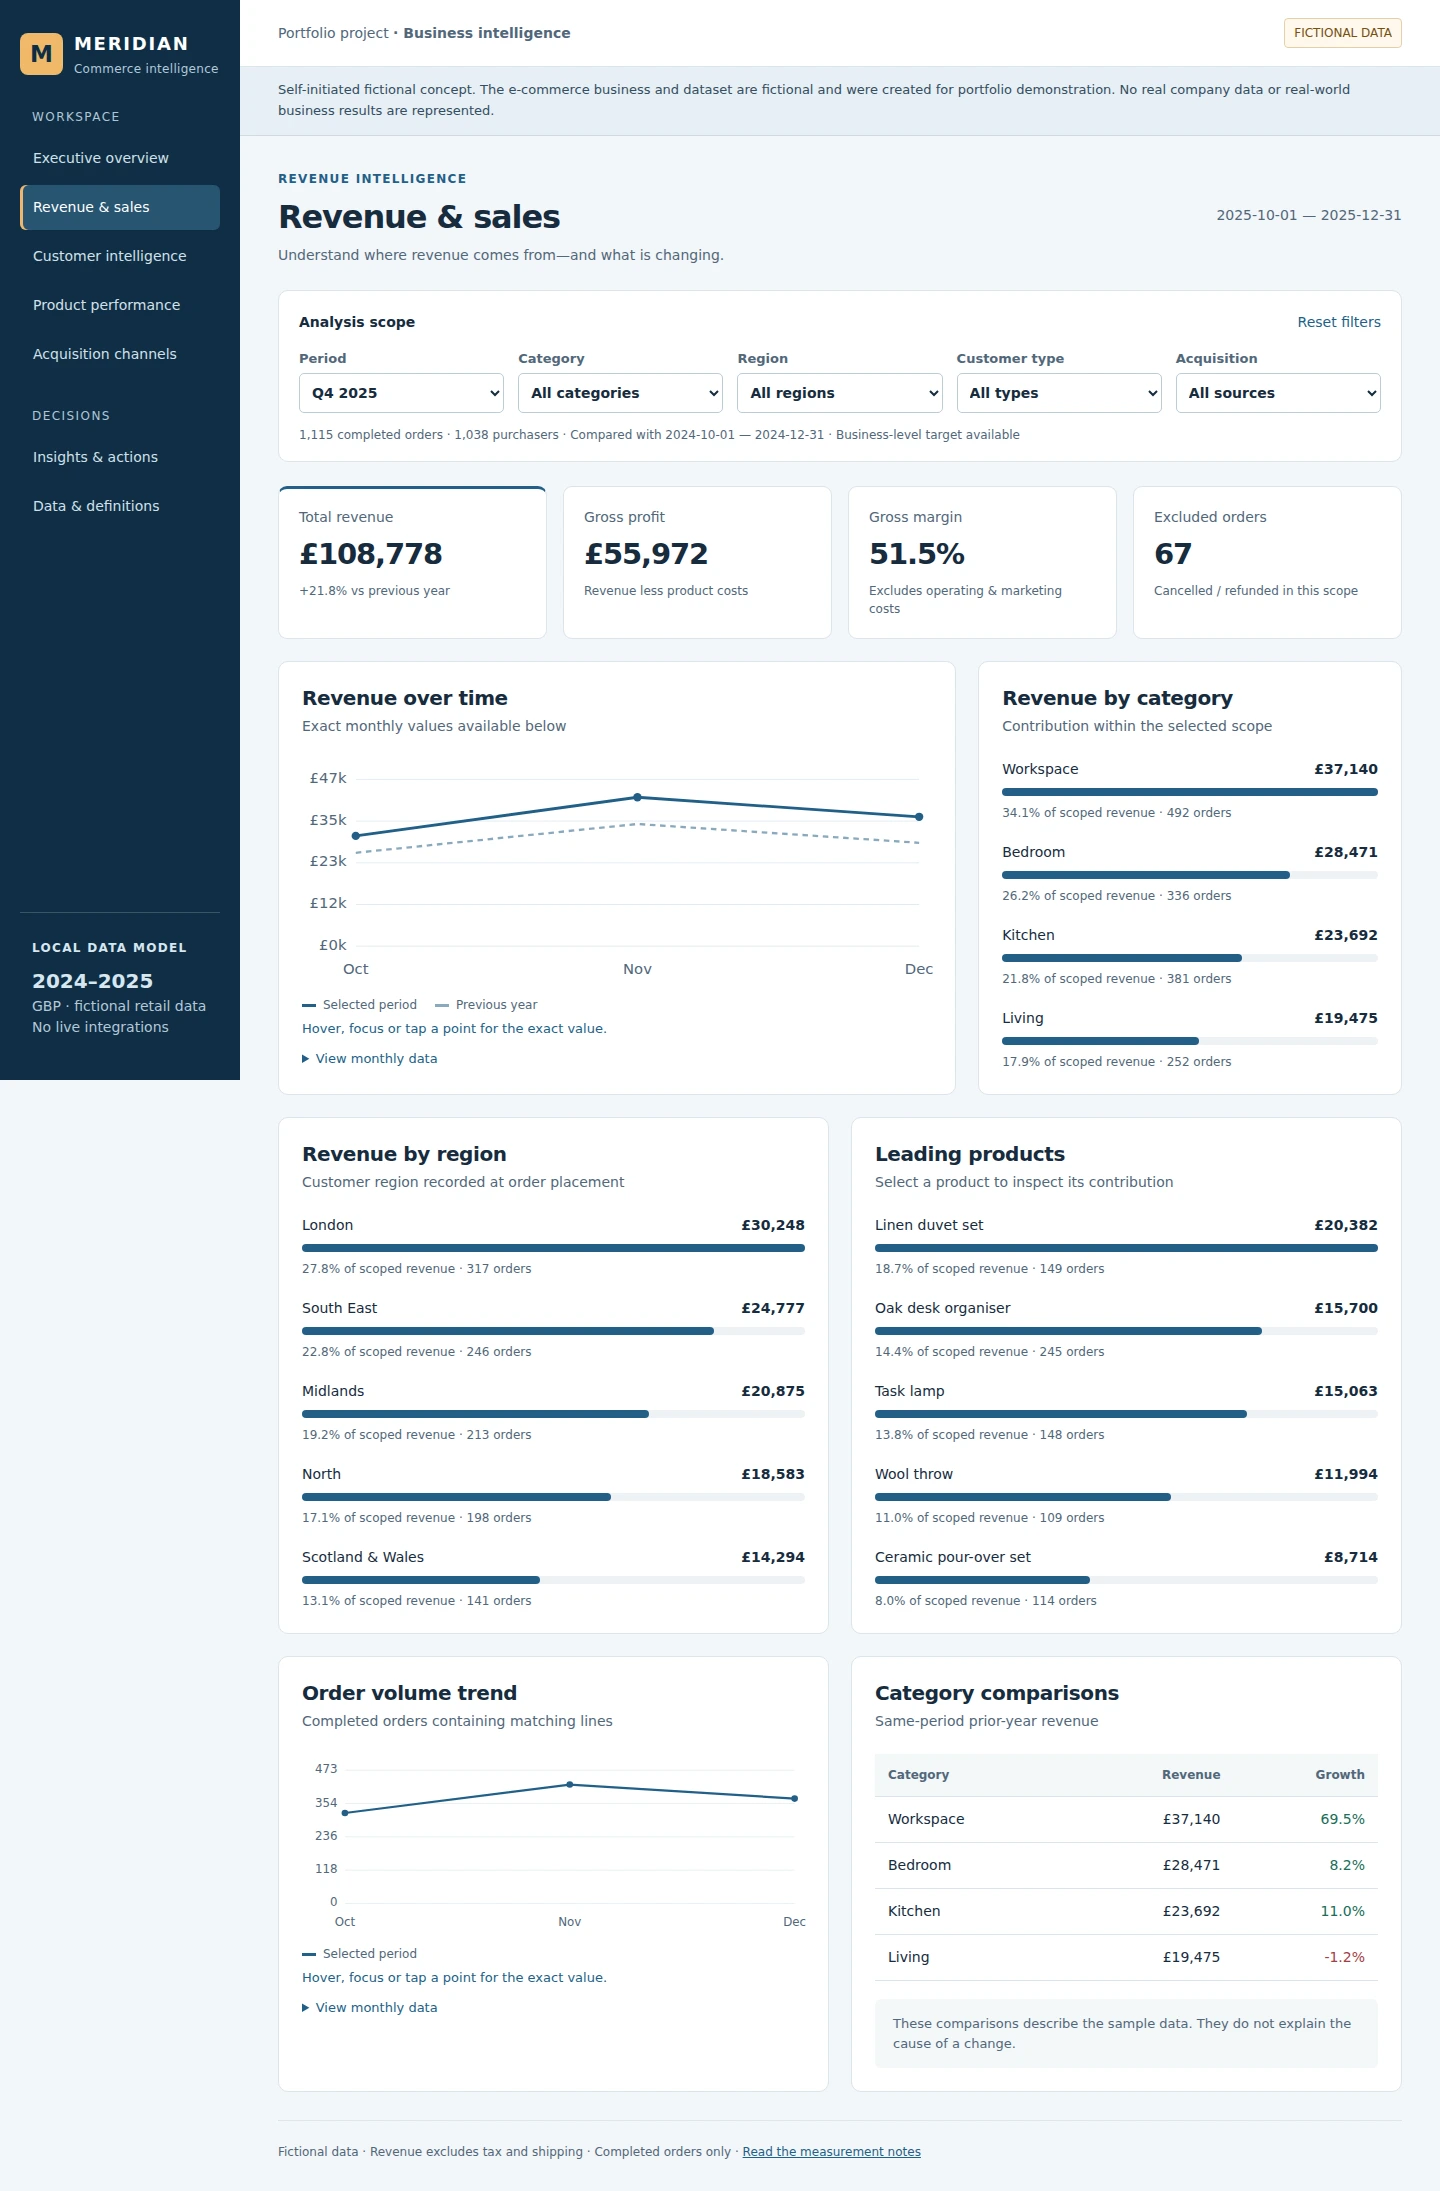
Revenue intelligence: time, category, region and product contribution with a shared analysis scope.
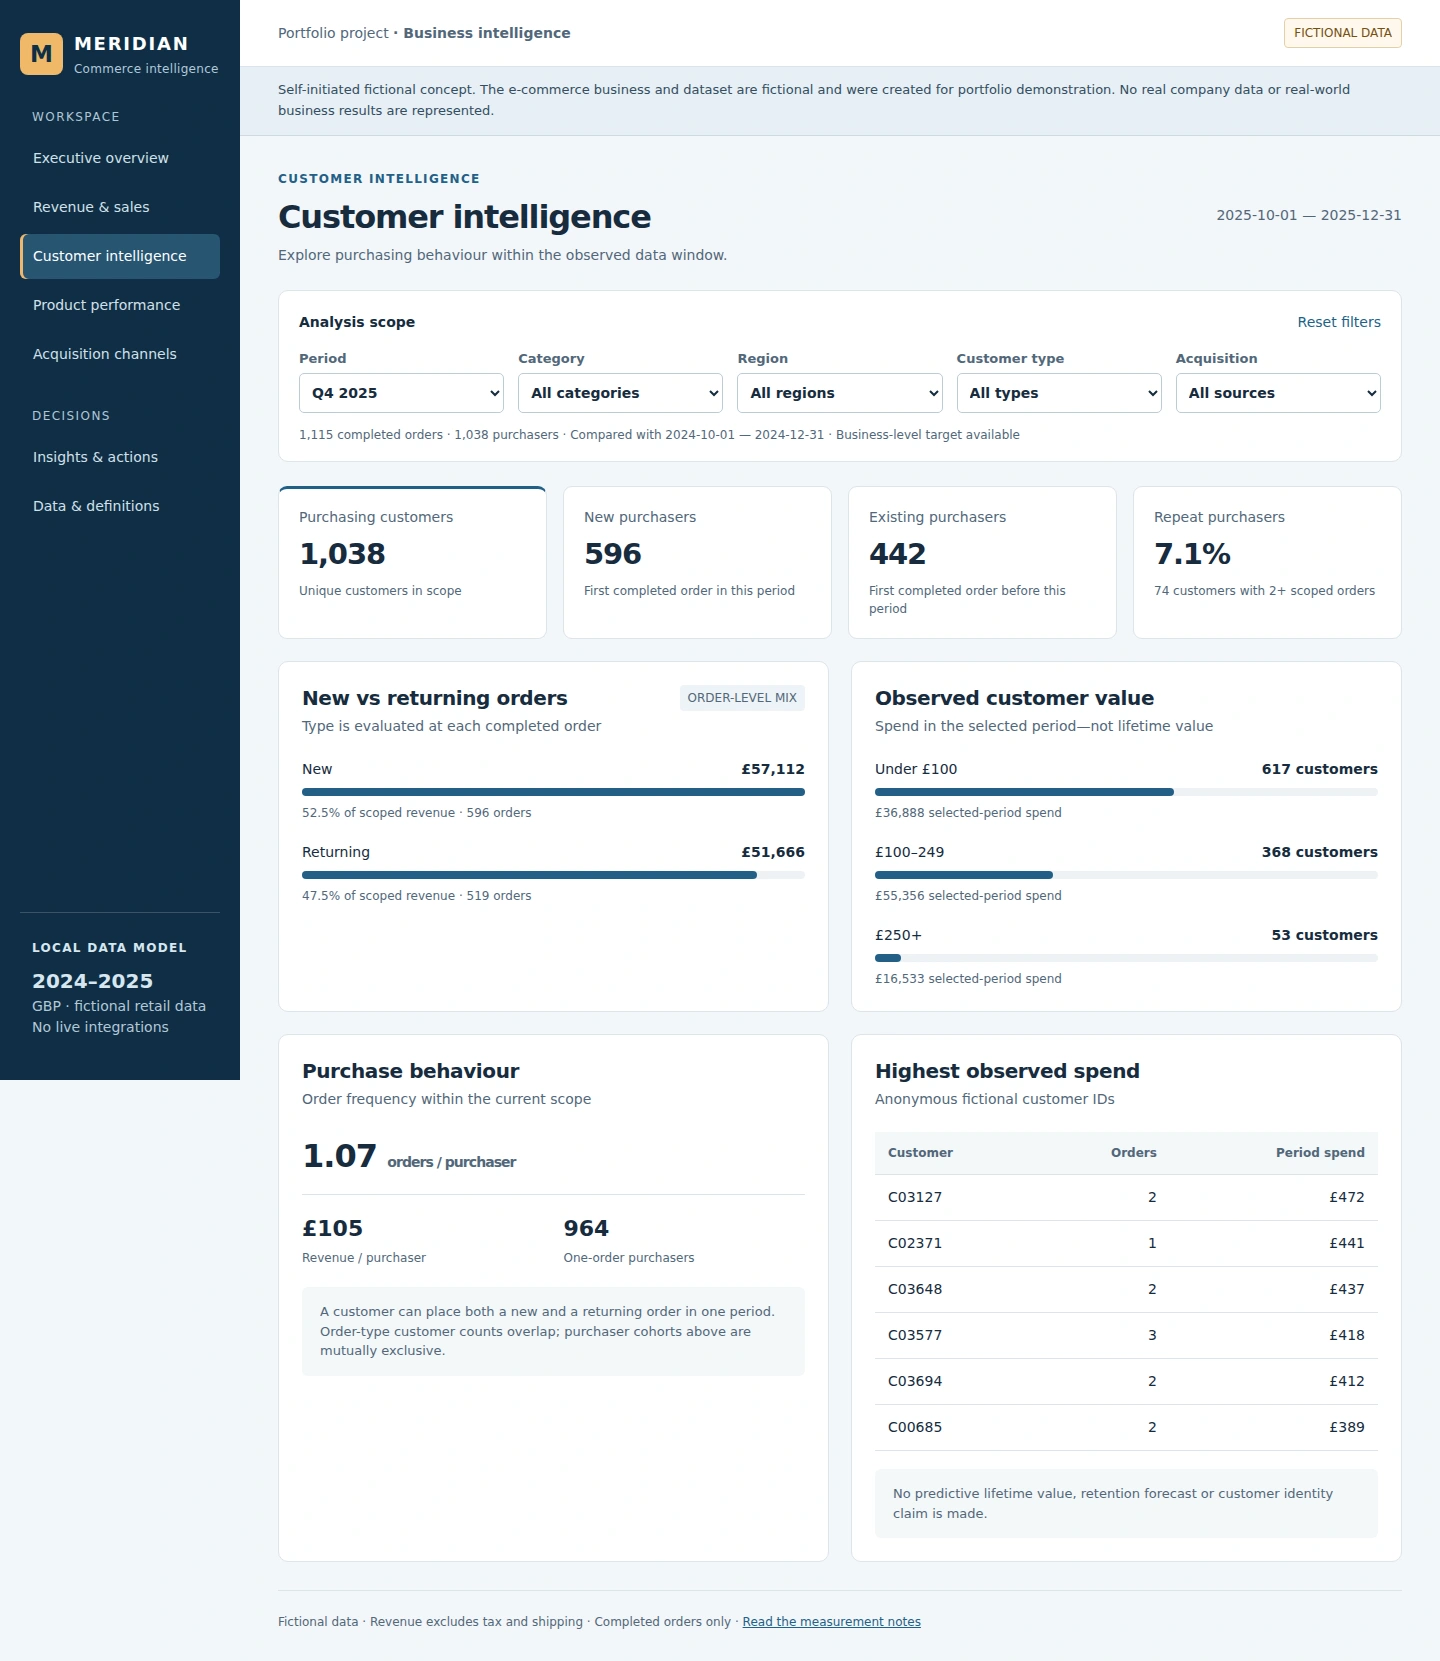
Customer intelligence: observed purchasing behaviour, new/existing purchasers and selected-period spend.
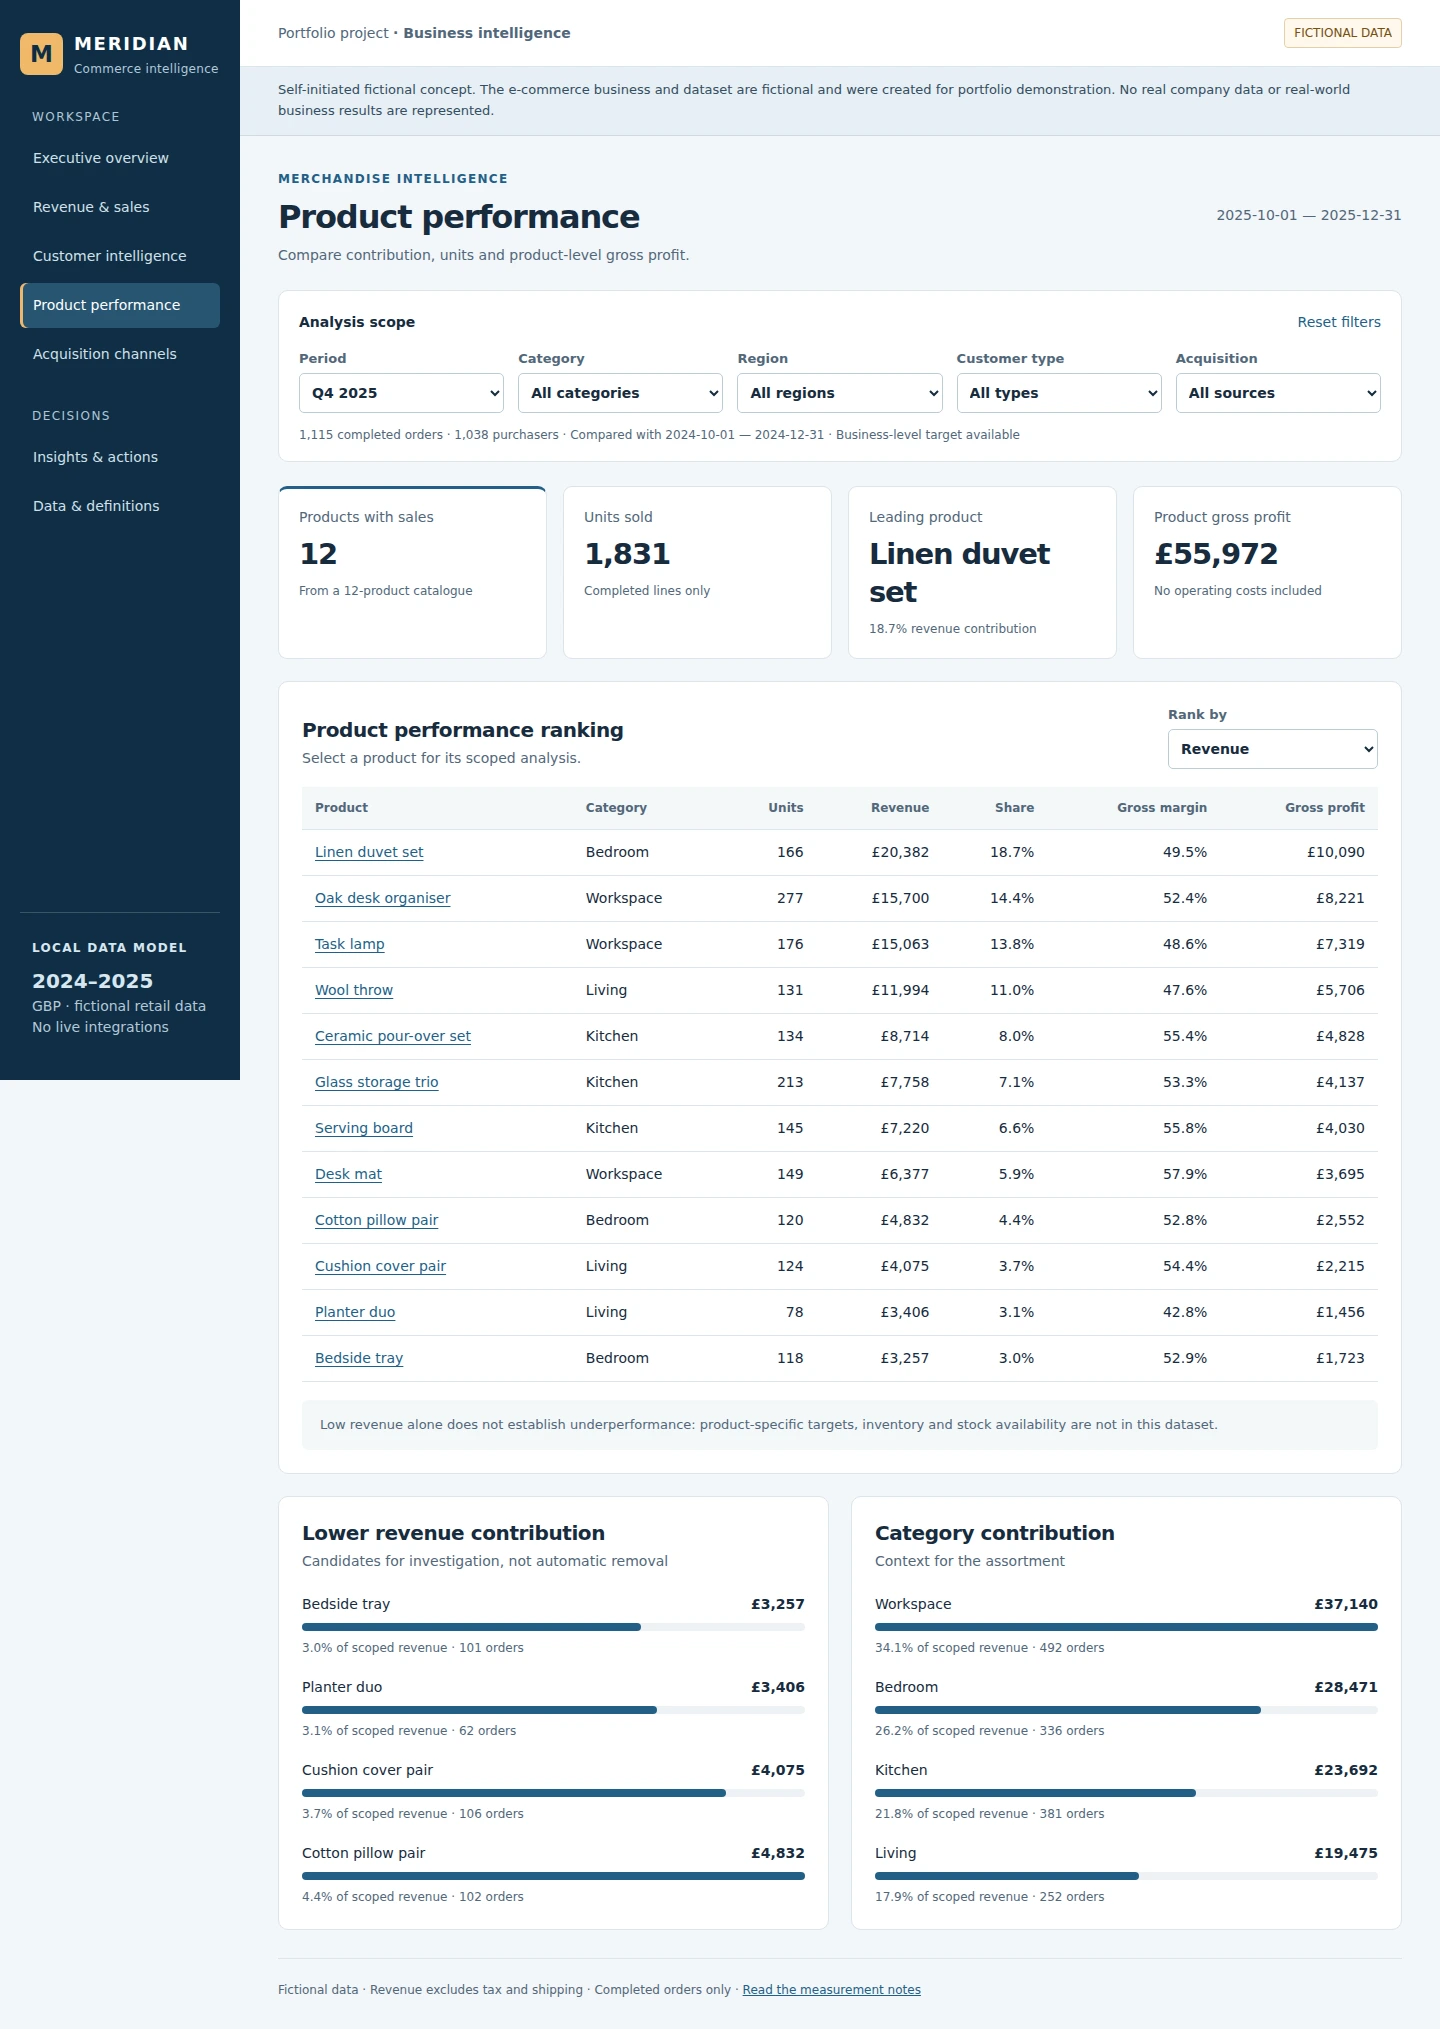
Product performance: scoped units, revenue, contribution and product-cost gross margin.
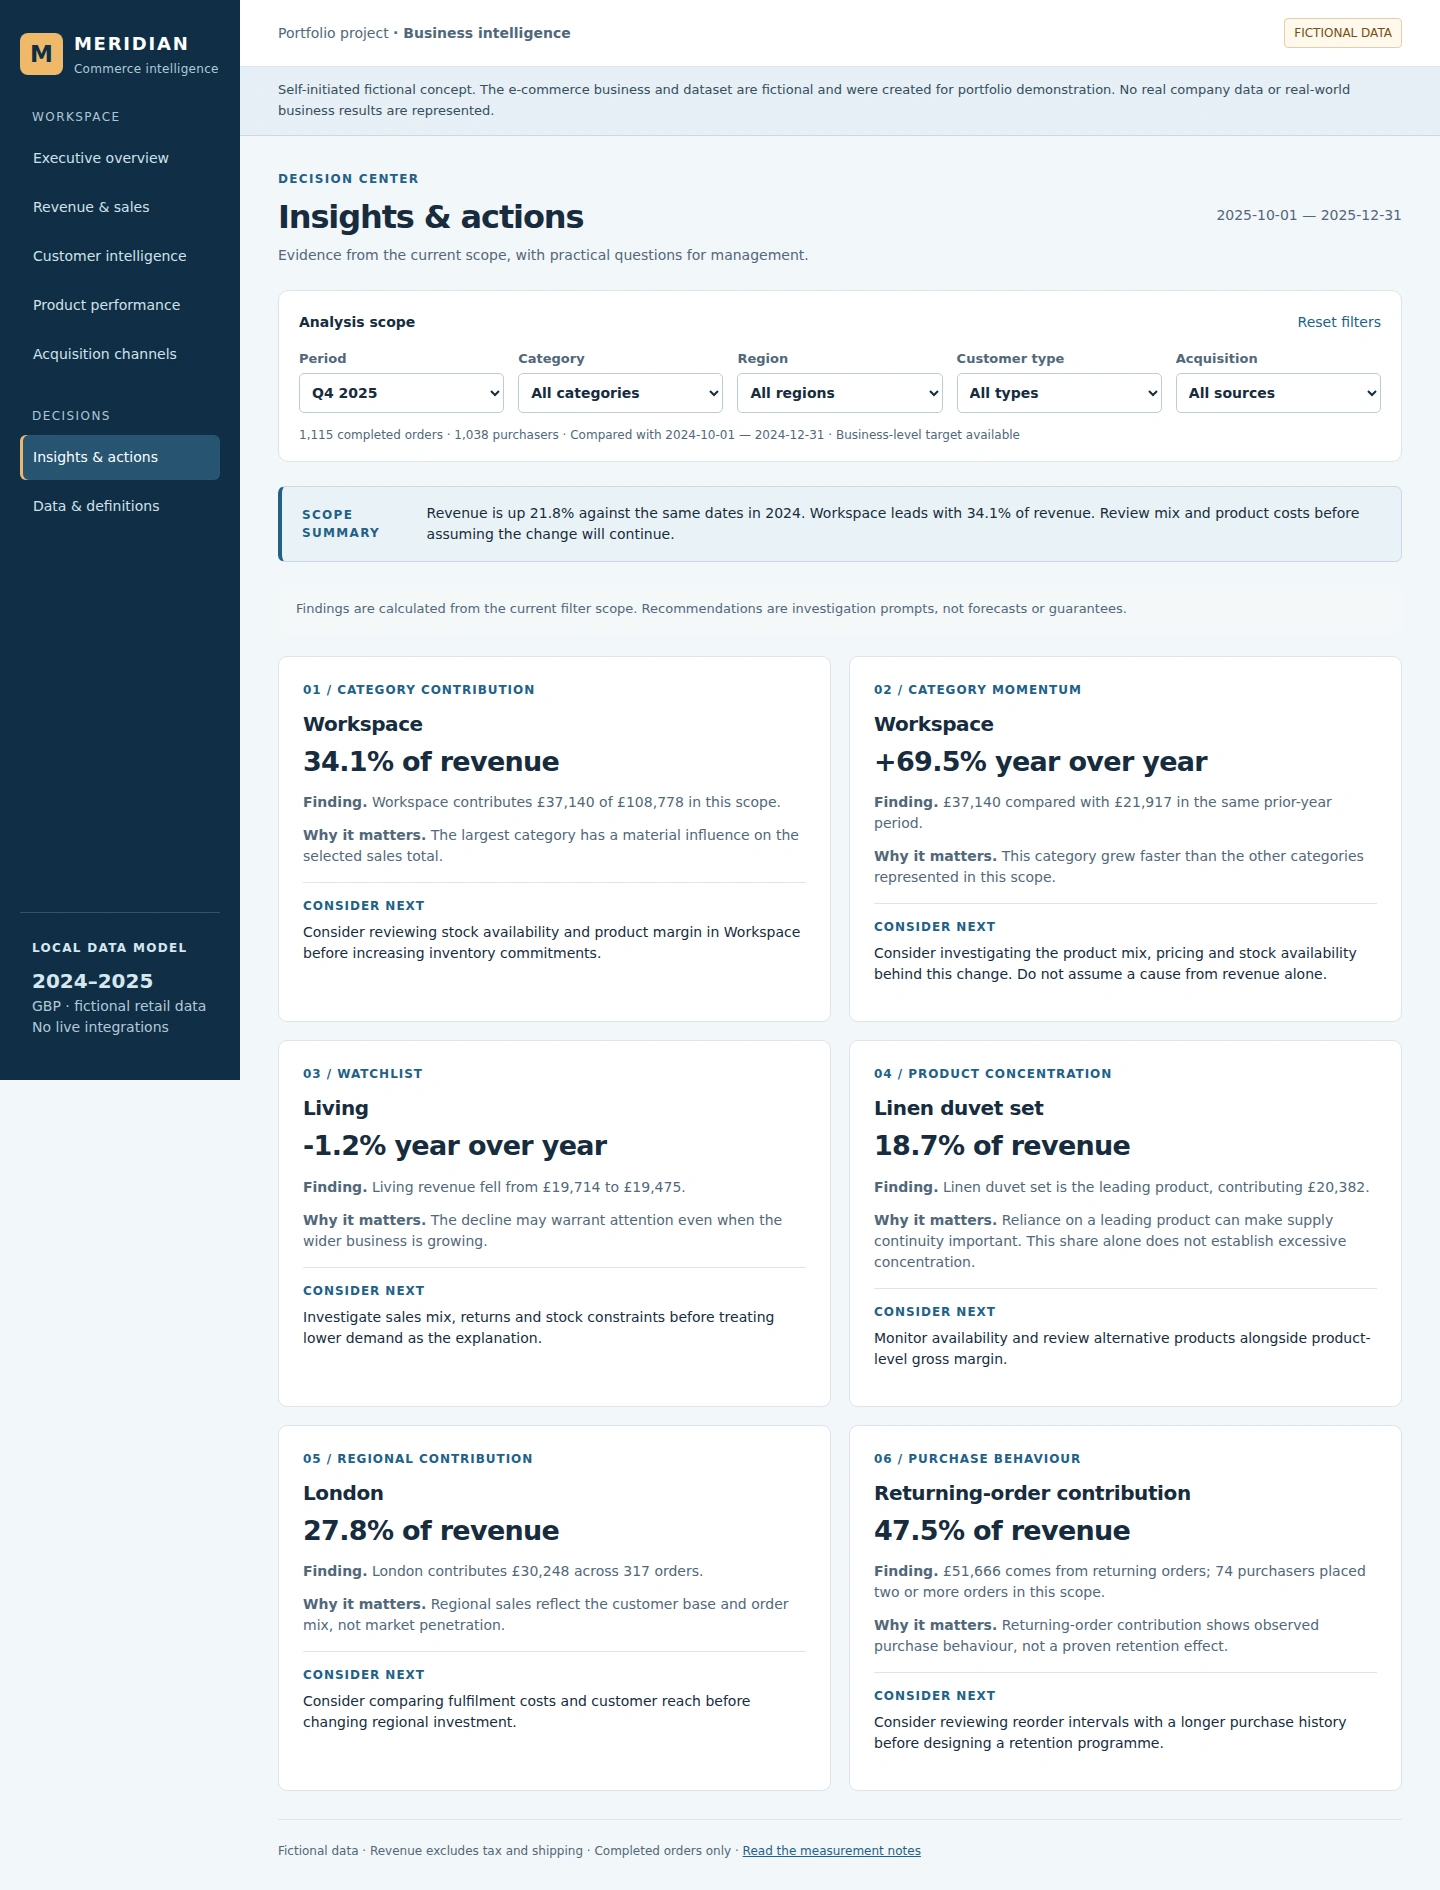
Decision center: calculated findings, business implications and conditional investigation prompts.

Responsive browser capture of the executive view with reorganised KPIs and navigation.

Responsive browser capture with Workspace and North filters applied to sales analysis.
Like this project
Posted Oct 7, 2026
Self-initiated e-commerce BI demonstration connecting fictional order data to calculated KPIs, interactive analysis and evidence-based decision prompts.
Likes
0
Views
1