The network for creativity
Join 1.25M professional creatives like you
Connect with clients, get discovered, and run your business 100% commission-free
Creatives on Contra have earned over $150M and we are just getting started
Back to feedPost

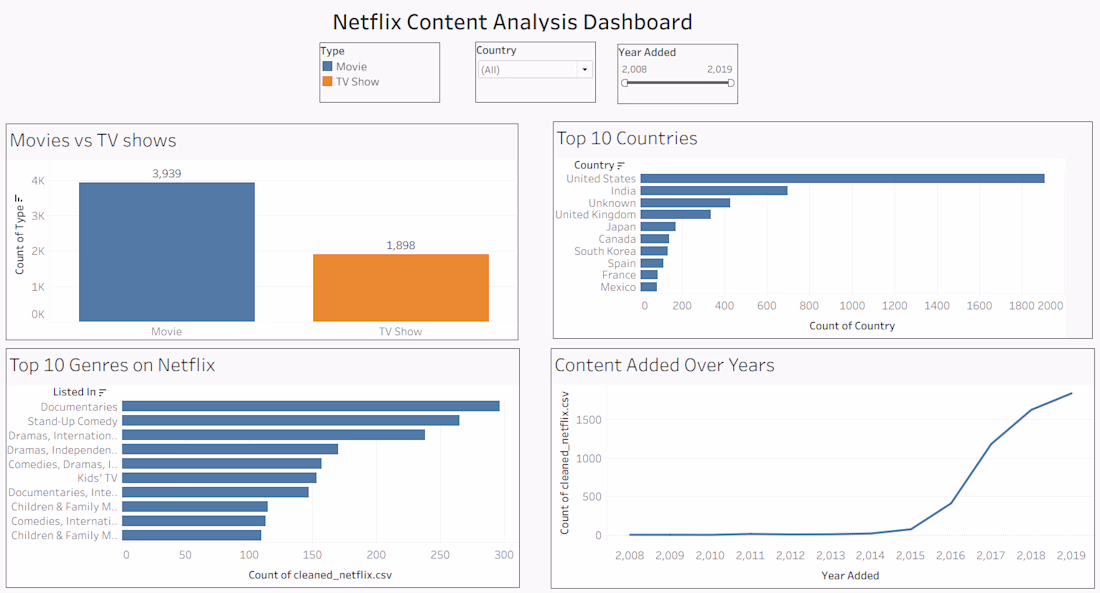
Created an interactive Tableau dashboard to analyze Netflix content by type, country, genre, and year added. The project highlights key insights such as the higher number of Movies compared to TV Shows, top contributing countries like the United States and India, popular genres, and the rapid growth of content after 2016. This project demonstrates skills in data cleaning using Python, data visualization, and dashboard design using Tableau.


good job
The network for creativity
Join 1.25M professional creatives like you
Connect with clients, get discovered, and run your business 100% commission-free
Creatives on Contra have earned over $150M and we are just getting started
Related posts

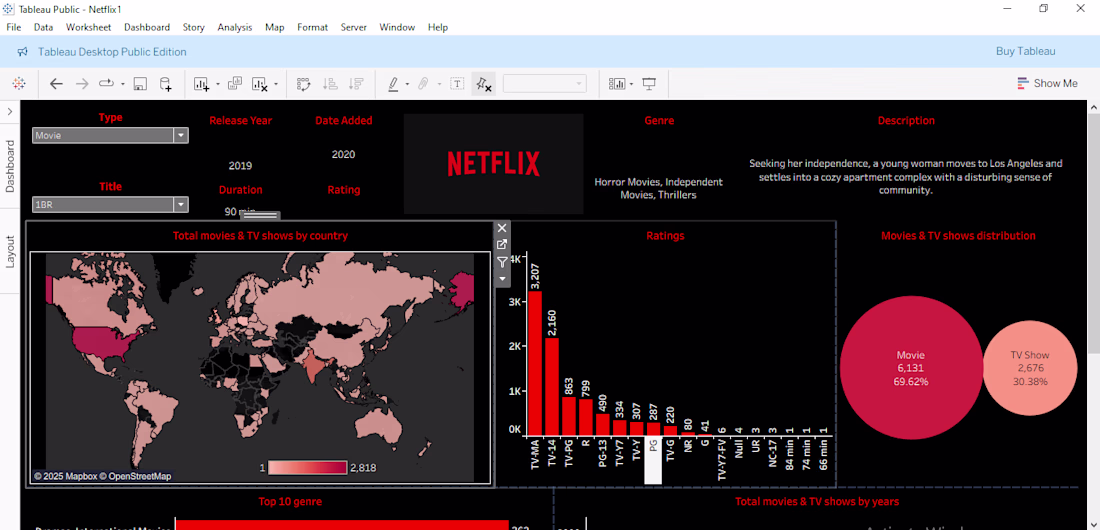
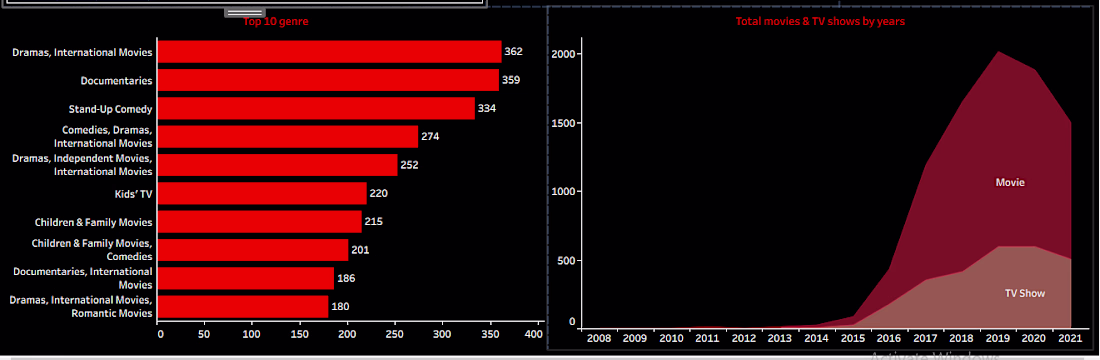
🎬 Netflix Titles Dashboard (Tableau)
Designed an interactive Tableau dashboard to analyse Netflix’s content library and uncover trends across genres, countries, and release years.
📊 Visualized content distribution between Movies & TV Shows
🌍 Analysed global content production with focus on top countries
📅 Identified growth trends in content additions over time
⭐ Explored ratings and genre patterns to understand audience targeting
💡 Delivered key insights on content diversity, growth, and viewing trends to support data-driven storytelling
🛠️ Tools Used: Tableau, Excel, Kaggle Dataset
🚀 Built a clean, interactive dashboard to transform raw data into meaningful visual insights

Superstore Sales Dashboard & Forecasting🙌
• Developed interactive dashboard analyzing 10,000+ transactions to track revenue and profit metrics.
• Performed trend analysis and 15-day forecasting, reducing manual reporting effort by 40%.
• Provided insights to improve inventory planning and sales monitoring.

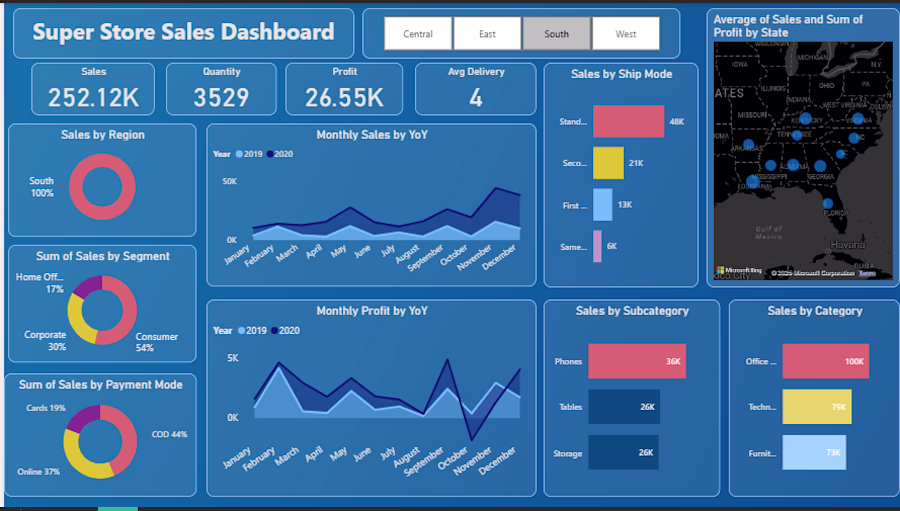
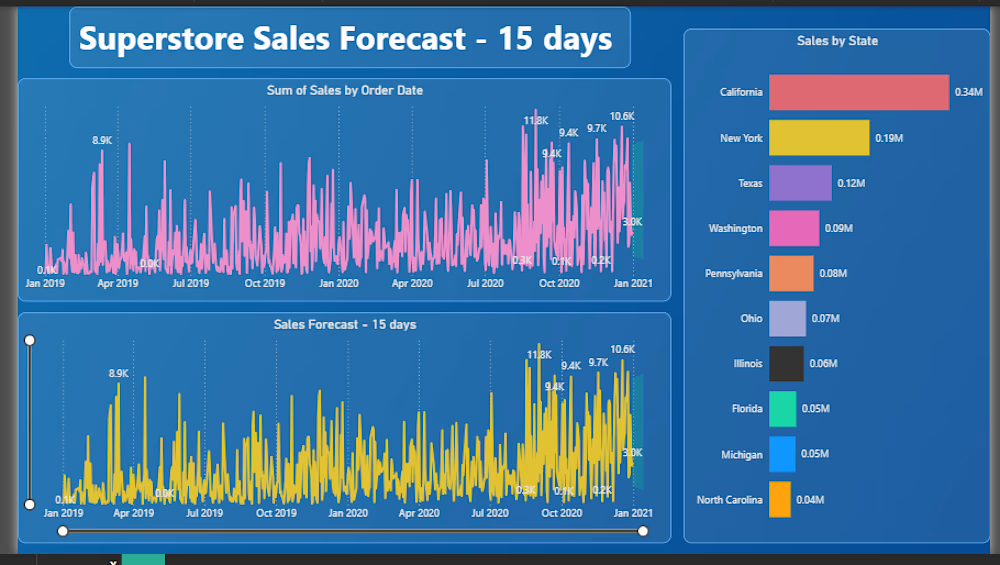

Adding a 15-day forecast alongside the sales dashboard is a smart move — most dashboards only show what happened, not what's coming. The YoY monthly comparison view gives really clear context too. Did you build the forecasting model using Power BI's built-in analytics or a custom formula approach?
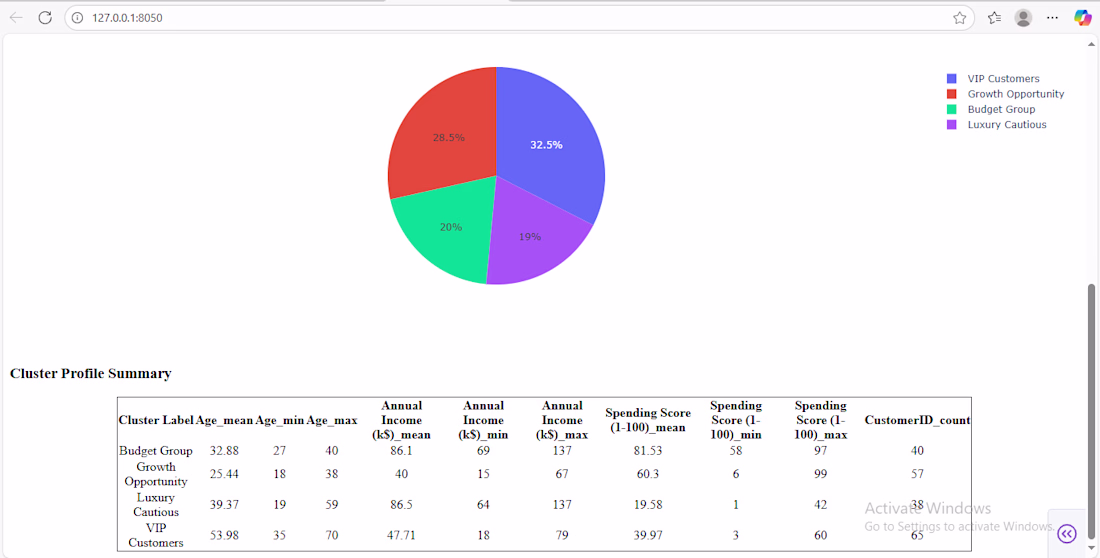
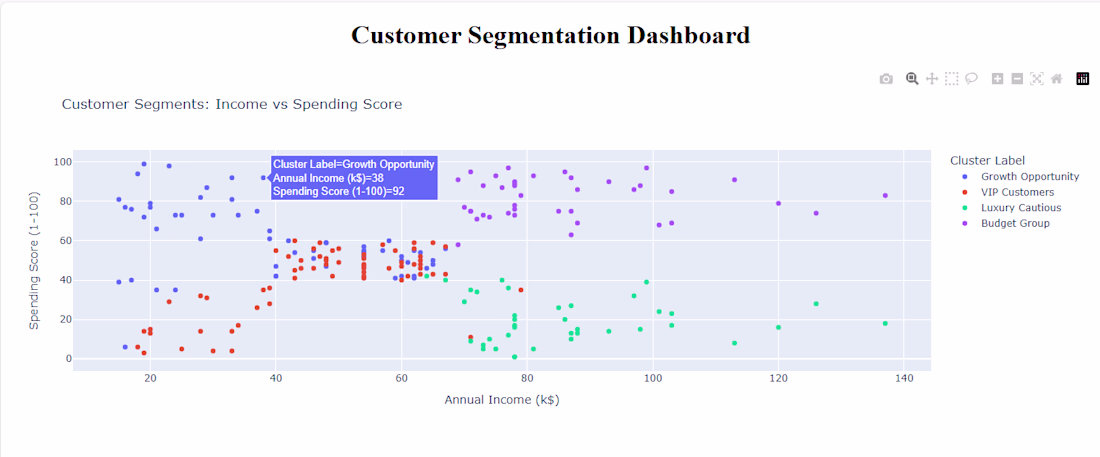
🛍️ Mall Customer Segmentation Project
Built an end-to-end machine learning solution to segment customers using K-Means clustering based on demographics and spending behaviour.
🔍 Performed data cleaning, pre-processing, and exploratory data analysis (EDA)
📊 Applied K-Means clustering with the Elbow Method to identify optimal customer segments
🧩 Engineered features to improve clustering performance
📈 Developed an interactive dashboard using Plotly Dash for real-time segment exploration
💡 Identified high-value and low-value customer groups, enabling targeted marketing and improved customer engagement strategies
🛠️ Tools Used: Python, Pandas, Scikit-learn, Plotly Dash
🚀 Delivered a business-focused solution for customer segmentation and data-driven decision-making


Great job


Trending


FLORA
Reusable workflows are replacing one-off prompts in creative AI. Share what you're building in FLORA.
portfolioreview
The best portfolios tell a story, not just show a grid. Share yours for feedback.
brandguidelines
Brand guidelines are becoming living systems. What are you building for your clients?
freelancerlife
Freelancer life is wins, pivots, and everything in between. What’s yours right now?
aivideo
AI video tools are moving at warp speed. Which ones are you experimenting with?