The network for creativity
Join 1.25M professional creatives like you
Connect with clients, get discovered, and run your business 100% commission-free
Creatives on Contra have earned over $150M and we are just getting started
Back to feedPost
30+ pages, 3 weeks, and honestly one of my favorite projects in a while.
I'd been wanting to design something more tech-driven for a long time, and Gryd, a platform turning construction permit data into intelligence for insurers, lenders, and real estate teams, was exactly that.
Wireframes first, then UI across every page, fully responsive, with animation on the key screens, all built inside the brand the client had already set.
Case study's on my profile.
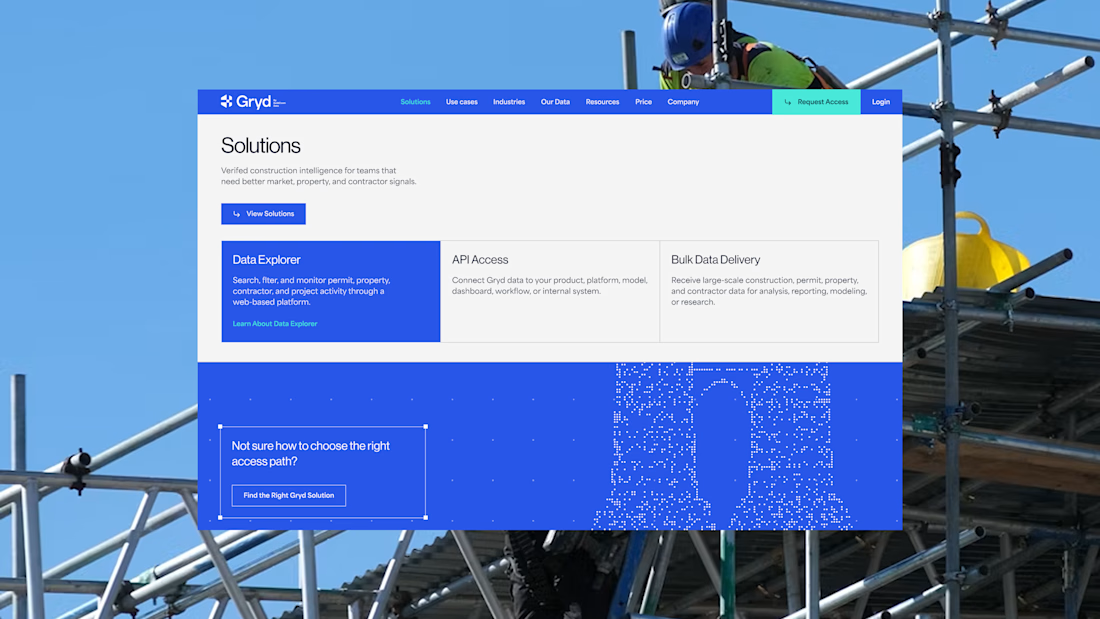
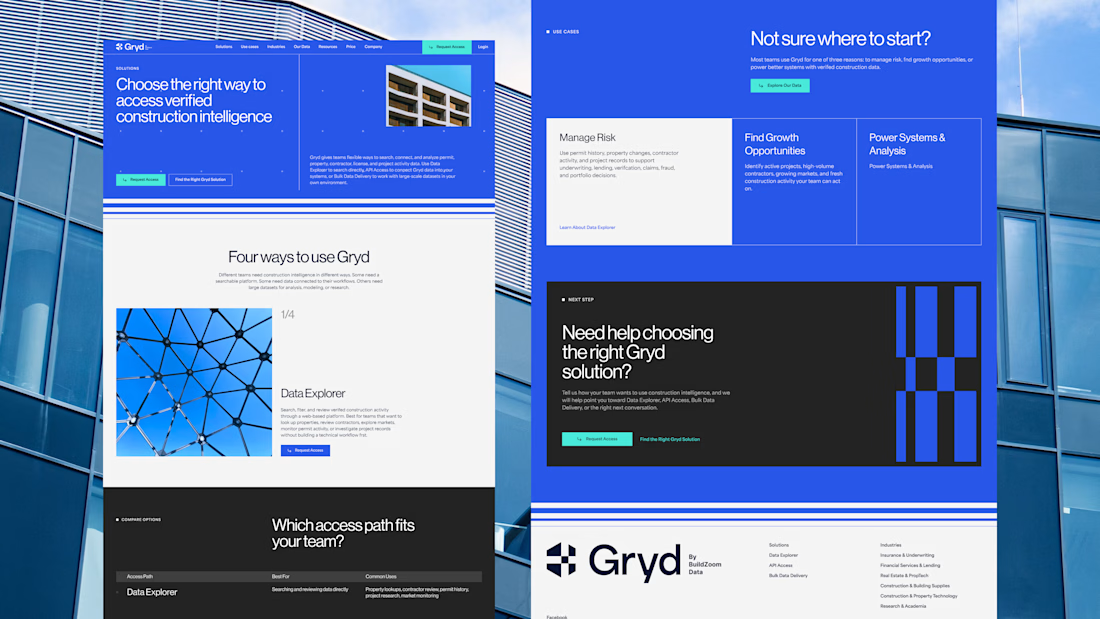
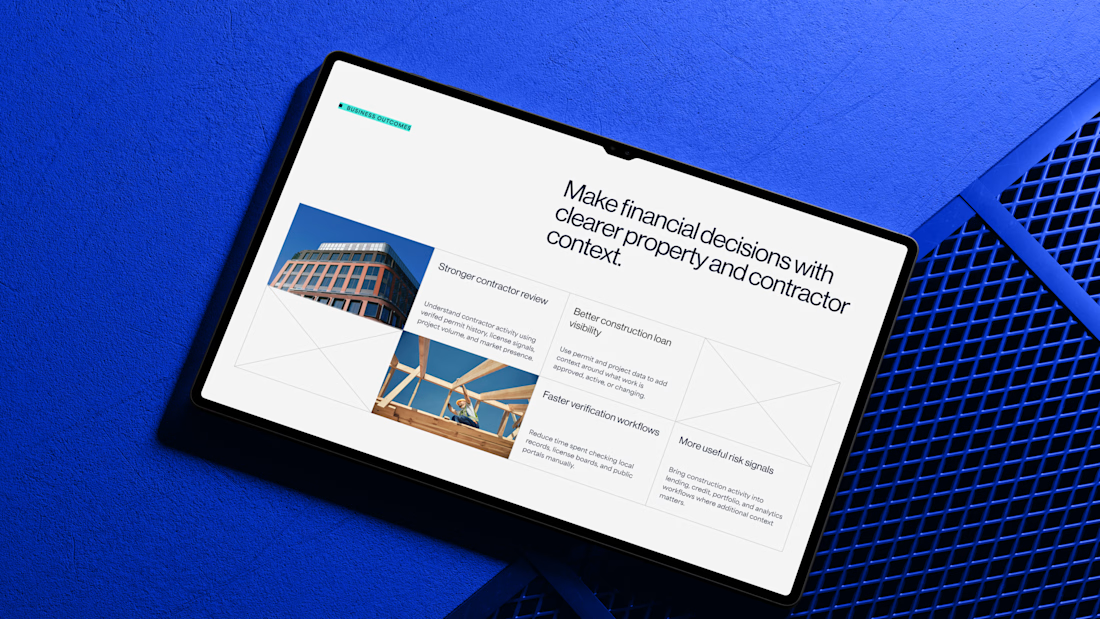

Working inside a brand system the client already had, across 30+ pages, is the part that doesn't show up in the screenshots - that's what keeps a construction-data platform looking coherent instead of like ten teams each got a page.

agree 😉

Clean design 😍
thanks a lot!

Nice visual

The calm screens fit a product built around permit data. If an insurer is making a decision from a result, showing the source and last updated date beside it would make that result easier to trust.

Love the colors!
Thanks! Same here!

pure design, good work
thanks a lot!

Clean


Good work👏🔥🔥

This is a strong systems case study—the way you carried a clear visual language across 30+ responsive pages while keeping the data-heavy product approachable is impressive.

Nice work
thank you!!😍


30 pages all holding that one blue is the impressive part

you made blue color really suit this web design

Clean work

really like your work and that kind of style! wow!

nice work

This is amazing!


Great design

Supreme work 🧡

Nice work

30+ pages in 3 weeks is quick, but the harder part is that permit data is genuinely boring and you made it look like something an underwriter would actually want to open. most of that category never escapes the spreadsheet. really good work.

Massive project! Executing 30+ pages so cleanly in just 3 weeks is super impressive. Love this tech-driven UI 🙌

Nice Work Nina
The choice to design the full system around construction-permit intelligence is compelling—data-heavy workflows often need that much structure to stay usable. The restrained animation on key screens sounds like a smart way to add orientation without competing with the information hierarchy.

Great Work!
Well done


Really impressive. 30+ pages in 3 weeks while keeping everything responsive and polished is no easy task. Great job!

Clean and amazing

Love the “data into intelligence” angle here. The real value starts when complex information is turned into something people can actually understand and use to make better decisions. That’s what makes projects like this more than just good looking interfaces.
The network for creativity
Join 1.25M professional creatives like you
Connect with clients, get discovered, and run your business 100% commission-free
Creatives on Contra have earned over $150M and we are just getting started



Related posts

If your members pay premium. Your website should look like it.
Animation really changes the way you look at a website.
The premium is in the details. 🤌
Hero section with animation for a Tennis Sports Club Membership Platform.
Full landing page WIP; gonna share it very soon.


The animation adds a lot to the premium feel for a tennis club membership platform. Looking forward to seeing the full landing page.

Bold Illustrations make an instant impact
See full case study here for the branding evolution and website redesign for a B2B SaaS startup!


I loved these colours. Looking Stunning 😍



Nice work