
Mamman Umar Dino
Data Analyst | Power BI, SQL & Excel Specialist



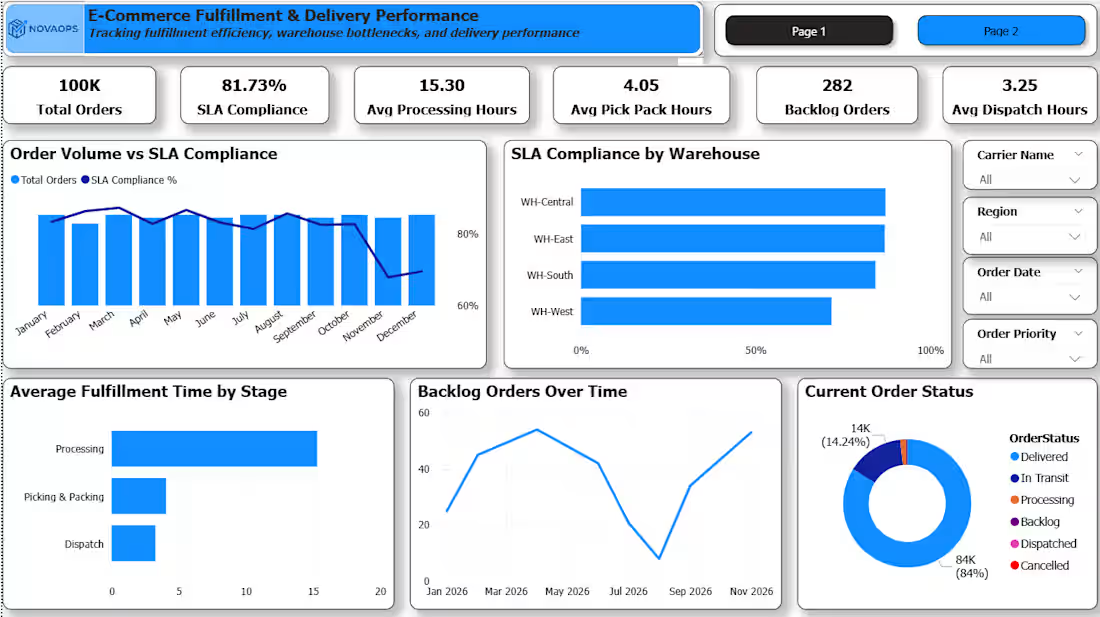
NovaOps — E-commerce & Operations Analytics
The problem:
Many businesses have plenty of sales and operational data, but still struggle to answer the questions that affect revenue, inventory, fulfillment, and day-to-day decisions.
Important problems can stay hidden:
Revenue or sales performance starts declining without a clear reason.
Poor-performing products are difficult to identify.
Inventory issues can lead to stockouts, excess stock, or missed sales.
Delivery and fulfillment delays affect customer experience.
Operational inefficiencies remain buried inside spreadsheets and raw data.
Management spends too much time compiling reports instead of acting on them.
NovaOps turns that data into something management can actually use.
It is an E-commerce & Operations Analytics solution designed to help businesses monitor performance, identify problems, uncover opportunities, and make faster, data-driven decisions.
What NovaOps helps solve
📊 Sales Performance — Understand revenue, orders, products, and trends.
📦 Inventory & Stock Risk — Identify products that need attention before inventory problems become costly.
🚚 Fulfillment & Delivery — Monitor operational performance and uncover delays and bottlenecks.
🔎 Performance Gaps — Quickly see where the business is underperforming and what deserves attention.
💡 Decision Support — Transform raw business data into clear insights and actionable recommendations.
The business value
Instead of spending hours going through spreadsheets and disconnected reports, decision-makers get a clearer view of what is happening, why it matters, and where to act.
NovaOps can help businesses reduce avoidable losses, improve operational visibility, identify revenue opportunities, and make better decisions faster.
Built with SQL, Excel, and Power BI, with the focus always on the business problem not just the charts.
If your business has data but you're not getting enough value from it, NovaOps is built to close that gap.
2
2
558
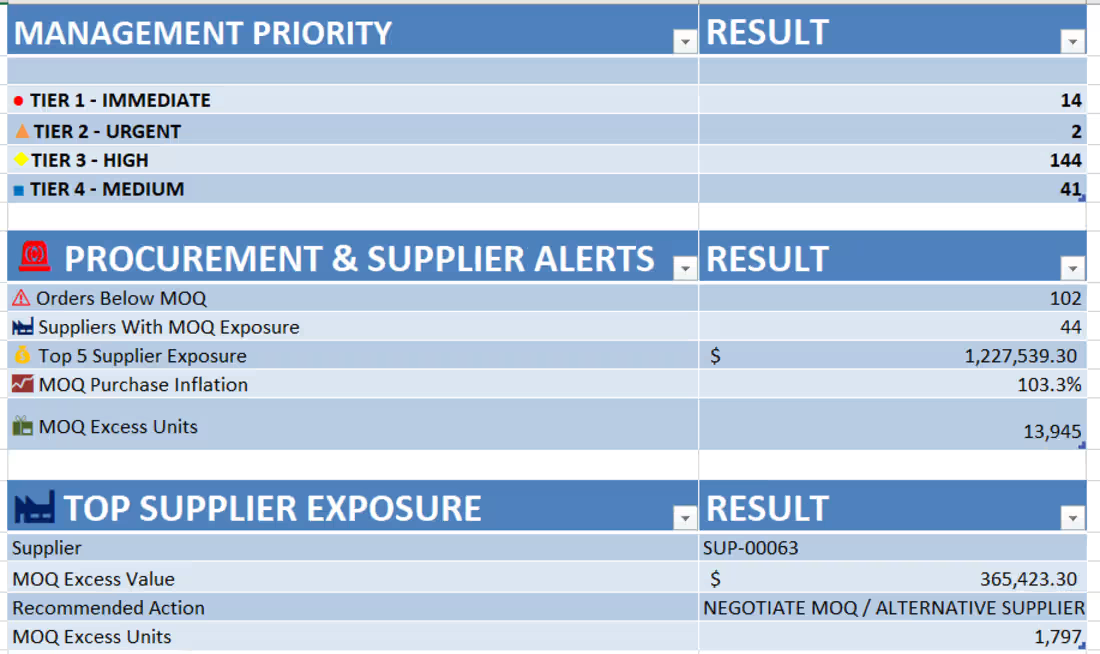
How much money could your e-commerce business be losing because you don't know what to reorder — or when?
Stockouts don't just mean an empty shelf.
They can mean:
→ Lost sales when customers can't buy what they want
→ Revenue tied up in products that aren't moving
→ Emergency replenishment and unnecessary shipping costs
→ Cash trapped in excess inventory
→ Time wasted manually checking which SKUs need attention
That's the inventory problem I wanted to solve.
I built an E-Commerce Inventory Replenishment & Stockout Control System that uses sales and inventory data to help businesses identify:
📌 Which products are approaching stockout
📌 How many days of stock are remaining
📌 Which SKUs need replenishment first
📌 What inventory could remain after supplier lead time
📌 Where potential revenue is at risk
The goal is simple:
Help businesses protect sales, reduce excess inventory, and make smarter replenishment decisions before inventory problems become expensive.
And importantly, this doesn't require a business to immediately invest in expensive inventory-management software.
A practical system built around the business's existing data can already provide significant visibility into where money is being lost and where inventory decisions need attention.
Because sometimes the biggest savings aren't found by selling more.
They're found by stopping avoidable inventory losses.
That's what I wanted this system to help businesses see.
#Ecommerce #InventoryManagement #DataAnalytics #Excel #Operations #InventoryOptimization
1
158
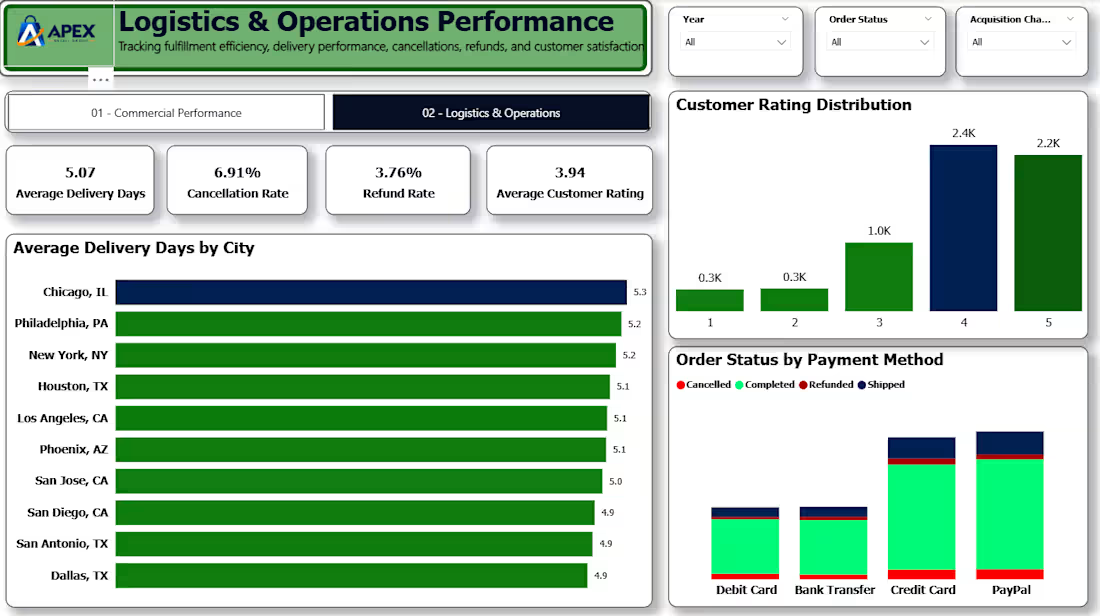
🚨 $2.04M in revenue. 6,000 orders. But what’s really happening inside the business?
I recently completed a simulated
e-commerce analytics case study focused on commercial performance and operations.
The objective was simple:
Turn transactional data into a clear decision-making tool for management.
Using Power BI, SQL & Excel, I analyzed the business across revenue, products, orders, customers, fulfillment and operational performance.
And the analysis uncovered several issues that could easily be missed in a traditional spreadsheet:
🔴 Revenue concentration: Electronics generated $1.1M+, while Laptop Pro 15 dominated product revenue creating significant dependency on a single category and product.
📉 Revenue decline: Monthly revenue peaked at $89.8K in February 2025 before trending downward through the latest 2026 periods.
⚠️ Order attrition: 6.91% cancellations + 3.76% refunds = 10.67% of placed orders not retained as completed sales.
⭐ Customer experience: 74% of rated orders received 4–5 stars, but roughly 1 in 4 ratings were 3 stars or below.
🚚 Operations: Average delivery time was 5.07 days, with only a 0.4-day spread across major cities suggesting delivery consistency was not the most pressing issue.
📊 The solution
I built a 2-page Commercial & Operational Performance Dashboard:
Page 1 — Commercial Performance
Revenue • Orders • AOV • Units • Monthly Trends • Category & Product Performance • Acquisition Channels
Page 2 — Logistics & Operations
Delivery Performance • Cancellations & Refunds • Customer Ratings • Payment Method & Order Status
But the dashboard doesn't just display what happened.
It creates a single view of where performance is strong, where revenue may be at risk, and which areas require deeper investigation.
Management can quickly identify:
• Where revenue is concentrated
• Where sales are being lost
• Which products and channels are performing
• Whether operational performance is becoming a concern
• Where further investigation should be prioritized
• That's the real value of business analytics:
Turning data into clarity for better decisions.
I'm building my expertise as an E-commerce & Operations Data Analyst, helping businesses use their data to understand performance, identify risks and make better operational decisions.
If your business has data but you're not getting clear answers from it, let's change that.
📩 DM me “ANALYZE” and let's discuss what your data could uncover.
2
169
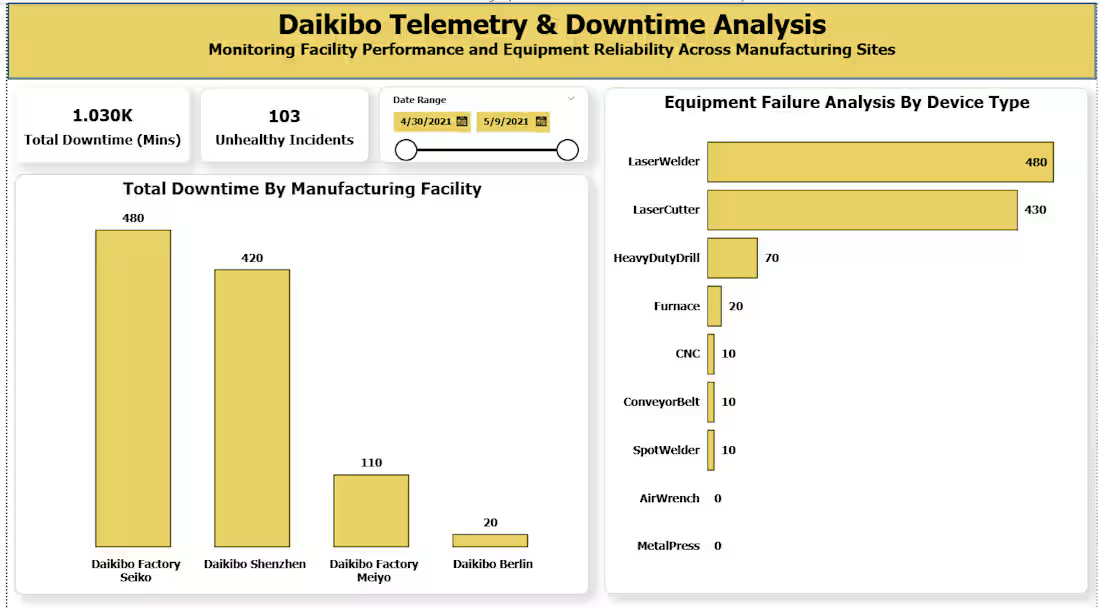
Completed the Deloitte Data Analytics virtual simulation by designing an interactive Power BI manufacturing telemetry downtime dashboard and executing a logical pay equity classification model in Excel to translate raw operational data into executive insights."
0
80