The network for creativity
Join 1.25M professional creatives like you
Connect with clients, get discovered, and run your business 100% commission-free
Creatives on Contra have earned over $150M and we are just getting started
Back to feedPost

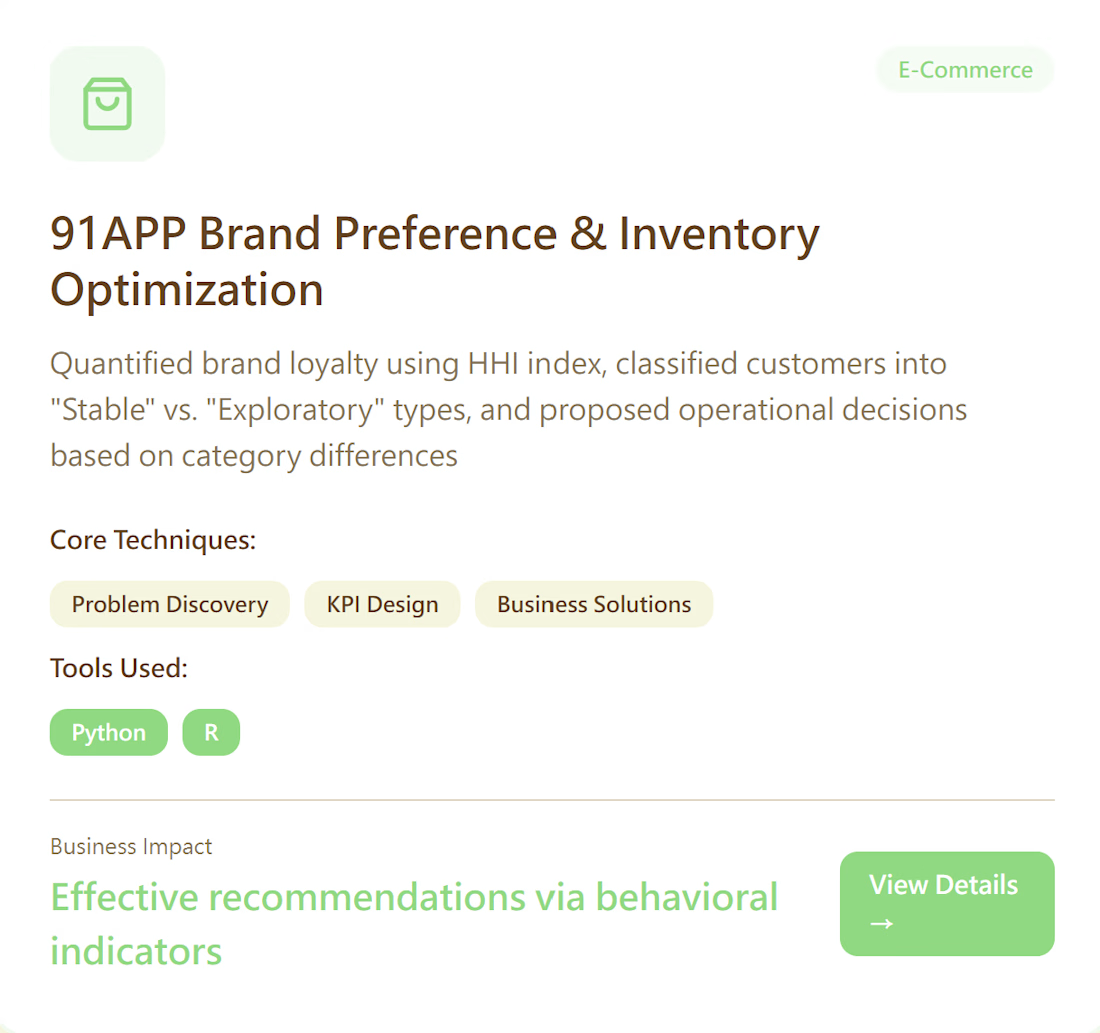
Project title: E-commerce Brand Preference and Inventory Strategy
Context: Analyzed real shopper data provided by e-commerce platform 91APP through a university course partnership. The brief was open, so our team had to find its own insights and decide how to use the data. We examined shopper behavior across three categories (health supplements, snacks, daily necessities) and sales channels to inform category management and inventory planning.
My role: Team project. I led team discussions, helped develop and narrow down our ideas, worked on the analysis, and prepared the final report. My analysis covered brand preference concentration (HHI, the Herfindahl-Hirschman Index), shopper segmentation into stable and diverse groups (K-means), and channel-level behavior comparisons across categories.
Methods and tools: Python, Excel. Regression, HHI, K-means clustering.
Outcome: Brand preference concentration split shoppers into stable (high concentration) and diverse groups, and their behavior varied strongly with product category, which pointed to category-specific marketing and operations strategies.
Customer value differs: stable shoppers bought less often but had a significantly higher average unit price than diverse shoppers (health supplements: NT$459.16 vs NT$367.64; personal care: NT$441.64 vs NT$241.77).
Categories where the two groups behave very differently (e.g., health supplements): recommended introducing new brands to diverse shoppers, and offering repurchase reminders and same-brand extension recommendations to stable shoppers.
Categories where both groups buy across many brands (e.g., snacks): recommended cross-brand recommendations supported by market basket analysis.
Categories dominated by one brand (e.g., oral care, where one brand held about 50% share in the data): recommended shifting the focus to precise inventory management, keeping choice available while lowering overstock cost and avoiding stockouts.



The network for creativity
Join 1.25M professional creatives like you
Connect with clients, get discovered, and run your business 100% commission-free
Creatives on Contra have earned over $150M and we are just getting started





Related posts

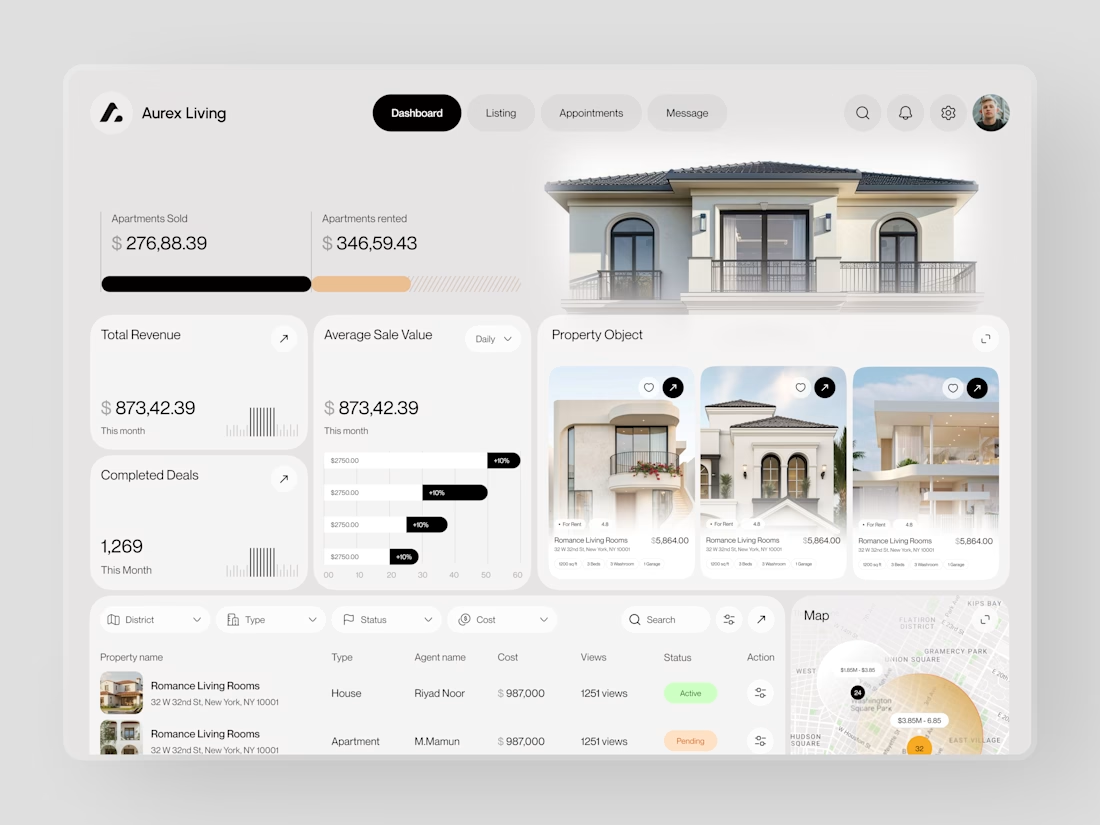
Real estate dashboards are usually built for data entry. Aurex Living was built for decision-making.
$873,42.39 total revenue. 1,269 completed deals this month. $276K sold, $346K rented. Property cards, agent tracking, map view, average sale value trending +10% - every number a real estate operator actually needs, on one clean white canvas.



Vänster Home GmbH
For Vänster Home GmbH, I engineered a high-end European e-commerce build designed to reflect modern architectural design and premium living space aesthetics. The goal was to establish strong brand authority through minimalist visual hierarchy, custom collection navigation, and high-converting storytelling.
I structured the homepage around a cohesive "Designed for..." campaign framework (covering Living, Dining, Lighting, and New Arrivals) to guide buyer intent seamlessly. To maximize user trust and clarity, I completely restructured the inventory data transforming long, cluttered supplier titles into refined product names paired with standardized technical specifications and lifestyle-focused features. This build demonstrates complete end-to-end e-commerce architecture, from editorial layouts down to conversion-focused product listings tailored for luxury retail shoppers.




Clean restructure from supplier titles to real product names, that step alone usually gets skipped. For a GmbH store selling into the rest of the EU, did you end up handling VAT-inclusive pricing per country through Shopify Markets, or did the client stick to one DE price shown everywhere?


My biggest case study yet: Bohemian Research.
Brand, website and app design for a research panel in 80+ countries. One playful but confident system for Multipolls, RewardsRoo and Golden Surveys.


