The network for creativity
Join 1.25M professional creatives like you
Connect with clients, get discovered, and run your business 100% commission-free
Creatives on Contra have earned over $150M and we are just getting started
Back to feedPost
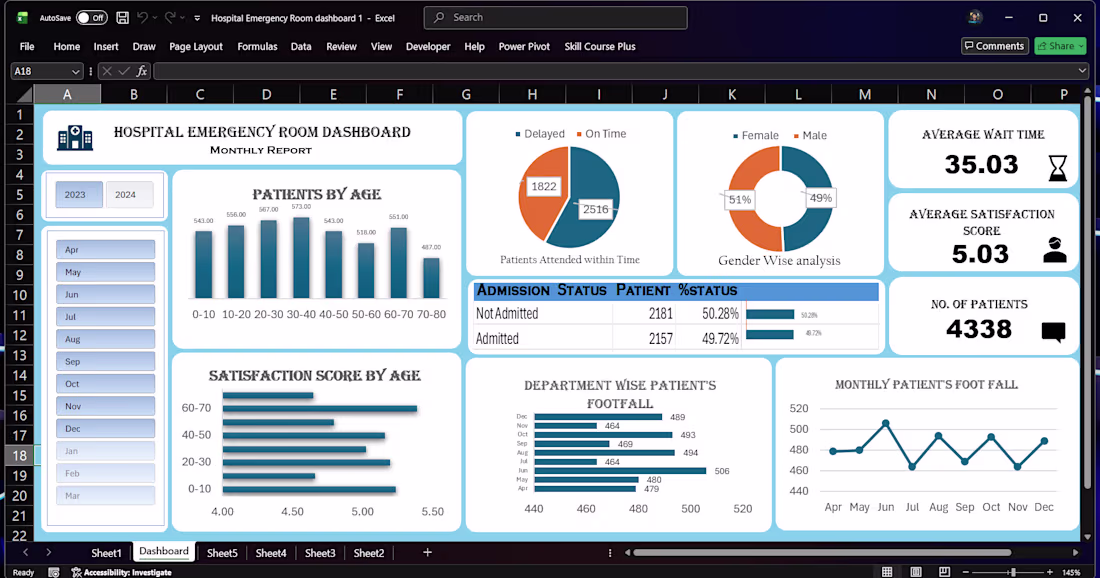
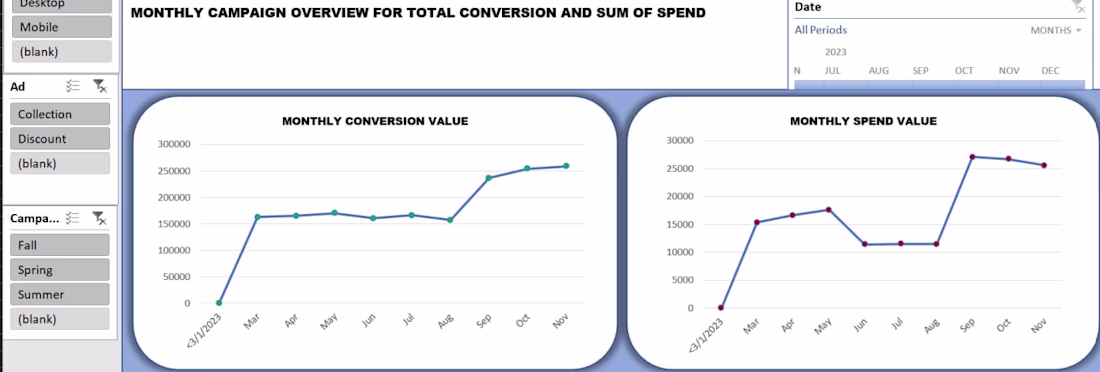
📊 Interactive Excel Dashboard with Data Cleaning & Insights
🔍 Project Overview
This project demonstrates how raw, unstructured data can be transformed into a clean dataset and converted into an interactive Excel dashboard for better business insights.
⚙️ Work Done
Imported raw data and cleaned it using Excel and Power Query
Removed duplicates and handled missing values
Standardized formats for consistency (dates, text, numbers)
Created calculated fields for key metrics
Built an interactive dashboard using Pivot Tables, Charts, and Slicers
📈 Dashboard Features
Dynamic filtering using slicers
Clear visualization of trends and performance
KPI tracking for quick decision-making
User-friendly layout for easy navigation
💡 Key Insights
Identified performance trends over time
Highlighted top and low-performing categories
Enabled quick comparison across different segments
🛠️ Tools Used
Microsoft Excel
Power Query
Pivot Tables & Charts
🚀 Outcome
The final output is a fully interactive dashboard that helps users:
Analyze data quickly
Make informed decisions
Reduce manual reporting effort
👉 Open to similar projects involving Excel dashboards, data cleaning, and reporting automation.
The network for creativity
Join 1.25M professional creatives like you
Connect with clients, get discovered, and run your business 100% commission-free
Creatives on Contra have earned over $150M and we are just getting started
Related posts
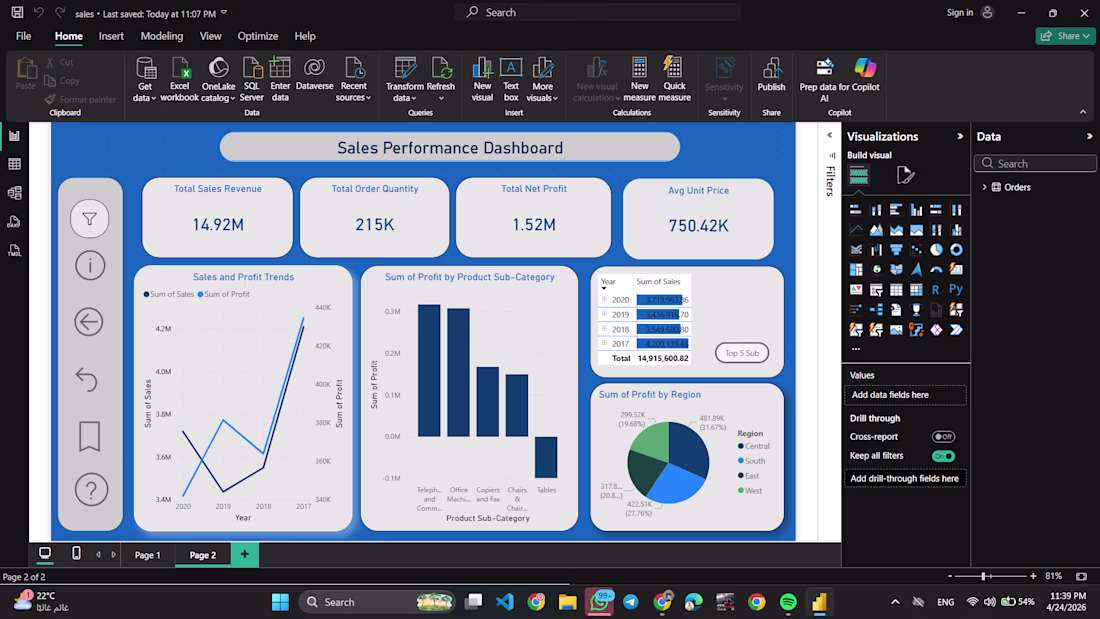
Visualizing the Full Sales Story
Data is only as good as the decisions it inspires. I built this dashboard to provide a high-level view of sales health while allowing for deep dives into specific regional performance.
Using SQL for initial data extraction and Power BI for the final visualization, I focused on creating a clean UI that highlights the most critical KPIs—total revenue and profit trends—at a glance.
great, keep it up !
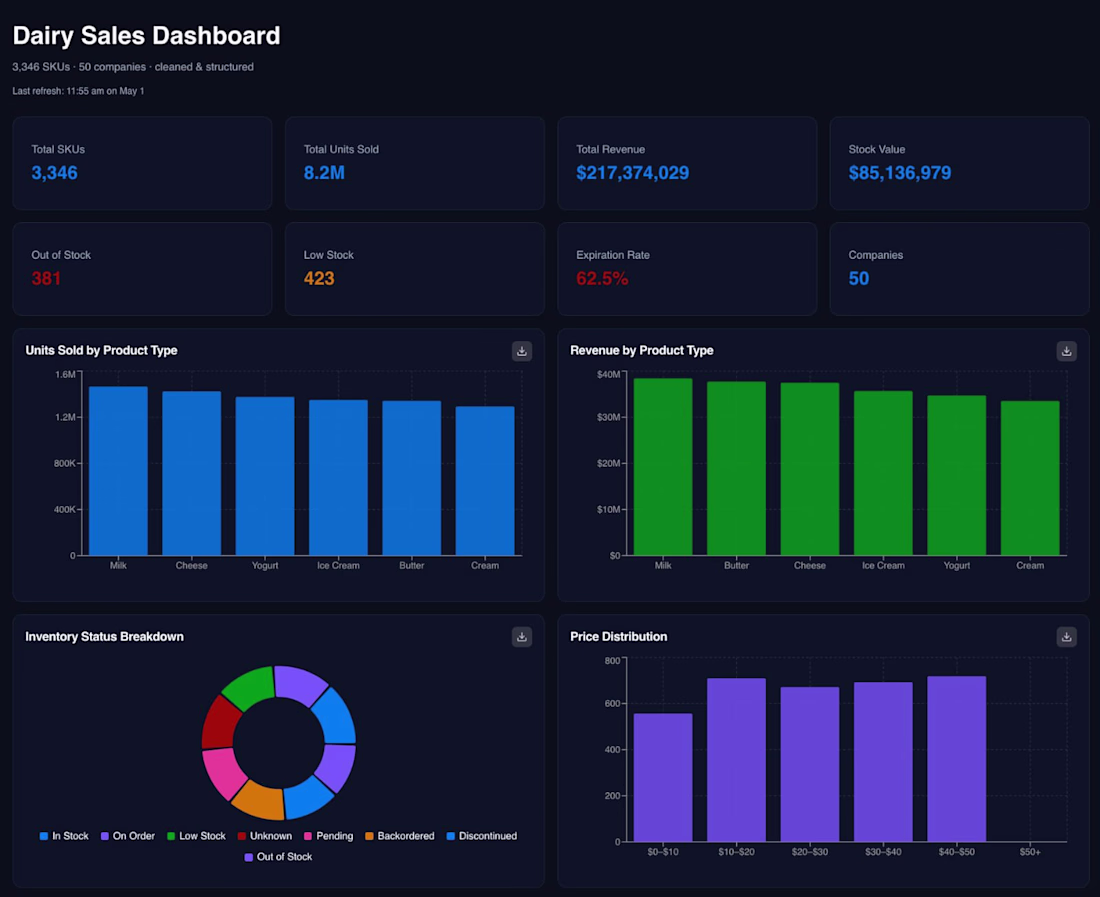
Dairy Sales Dashboard — Interactive Business Intelligence Report
Built a fully interactive sales dashboard for a dairy company dataset containing 3,346 SKUs across 50 companies, cleaned and structured from raw messy data.
What this dashboard includes:
KPI summary cards (Total Revenue, Stock Value, Units Sold, Expiration Rate)
Units Sold & Revenue breakdown by product type (Milk, Cheese, Yogurt, Ice Cream, Butter, Cream)
Inventory Status breakdown (In Stock, Low Stock, Out of Stock, Backordered, etc.)
Price Distribution analysis across price ranges
Tools & Skills used: Python, Pandas, data cleaning, data visualization, business insight generation
Business value: Helps business owners instantly spot which products are selling, which are expiring, and where inventory risks are — without touching a single spreadsheet.
nice, keep going
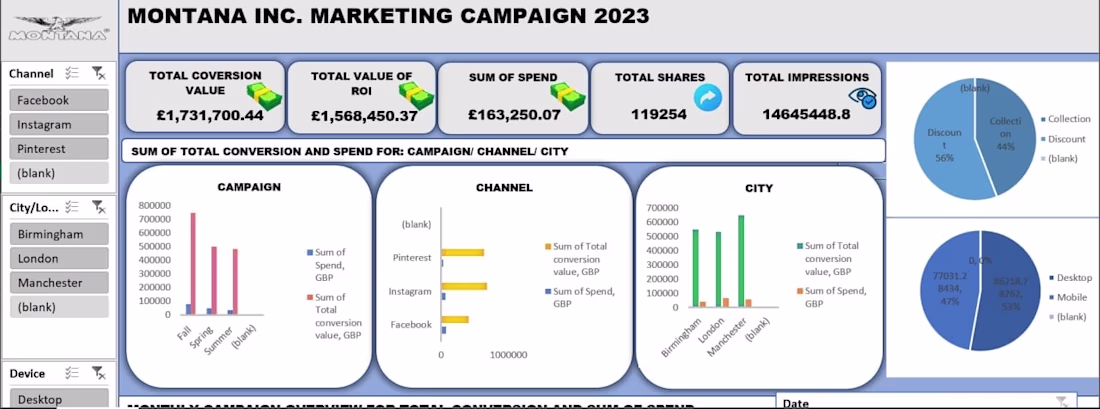
Montana Inc. Marketing Campaign Analytics 2023. An Excel dashboard analysing marketing performance across Facebook, Instagram, and Pinterest channels for campaigns run across Birmingham, London, and Manchester. The report tracked total conversion value of £1.73M against a total spend of £163,250, delivering a return on investment of £1.57M. Key insights included Facebook driving the lowest conversion despite highest spend, summer campaigns outperforming fall and spring, and mobile devices accounting for 53% of total conversions. Delivered an interactive dashboard with cross-filtering by channel, city, device, ad type, and campaign season.
Trending
Claude
Claude has entered the design space. How are you using Claude Design?
Contra University
Learn from expert creatives how to earn more using next-gen AI tools.
creativeaiflow
Creative AI workflows are evolving. What tools do you use, and what are their strengths and weaknesses?
portfolioreview
The best portfolios tell a story, not just show a grid. Share yours for feedback.
freelancerlife
Freelancer life is wins, pivots, and everything in between. What’s yours right now?