The network for creativity
Join 1.25M professional creatives like you
Connect with clients, get discovered, and run your business 100% commission-free
Creatives on Contra have earned over $150M and we are just getting started
Back to feedPost
Read the counts behind an A/B percentage.
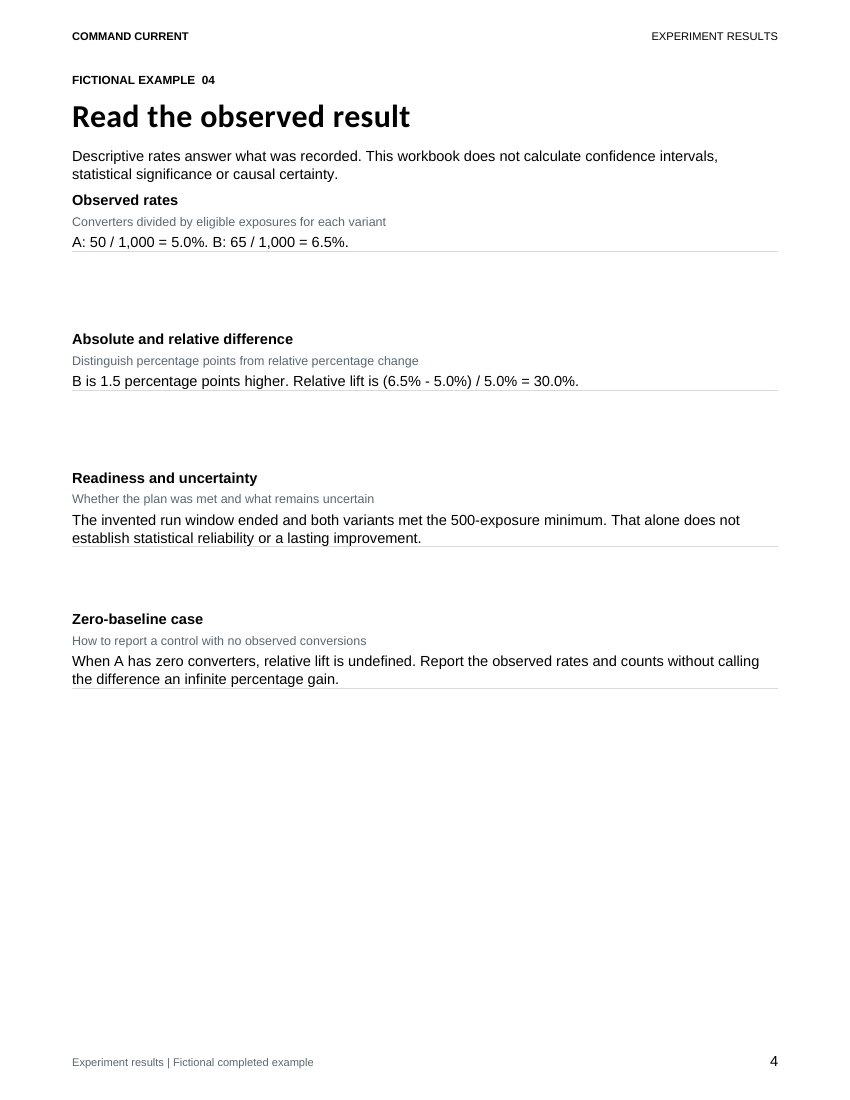
In this kit's fictional experiment, 50 of 1,000 eligible visitors complete a consultation form with button A. With button B, 65 of 1,000 do.
The observed rates are 5.0% and 6.5%. That's a difference of 1.5 percentage points. Relative lift divides that difference by A's rate: 1.5 / 5.0 = 30%.
Here's a practical way to record the comparison:
• Define one exposure and one conversion before the run. In this example, each eligible visitor counts once, and each visitor can convert once
• Set the window, exclusions, minimum counts and stopping rule before looking at results
• Keep both source exports and check that the counts use the same window and definitions
• Record both the percentage-point difference and relative lift. If A has no conversions, relative lift is undefined
• Document the next decision and uncertainty. Here, the fictional owner chooses another controlled test
Meeting the planned minimum is a review checkpoint. It doesn't establish statistical significance. The kit calculates descriptive rates and lift; it doesn't run a statistical test or establish causality.
The preview is the actual Read the observed result page from the fictional completed example. The Business Experiment and A/B Results Kit includes an editable Word packet, Excel tracker, print PDF, fictional completed example and Quick Start.

The network for creativity
Join 1.25M professional creatives like you
Connect with clients, get discovered, and run your business 100% commission-free
Creatives on Contra have earned over $150M and we are just getting started

Challenges
View all


Related posts

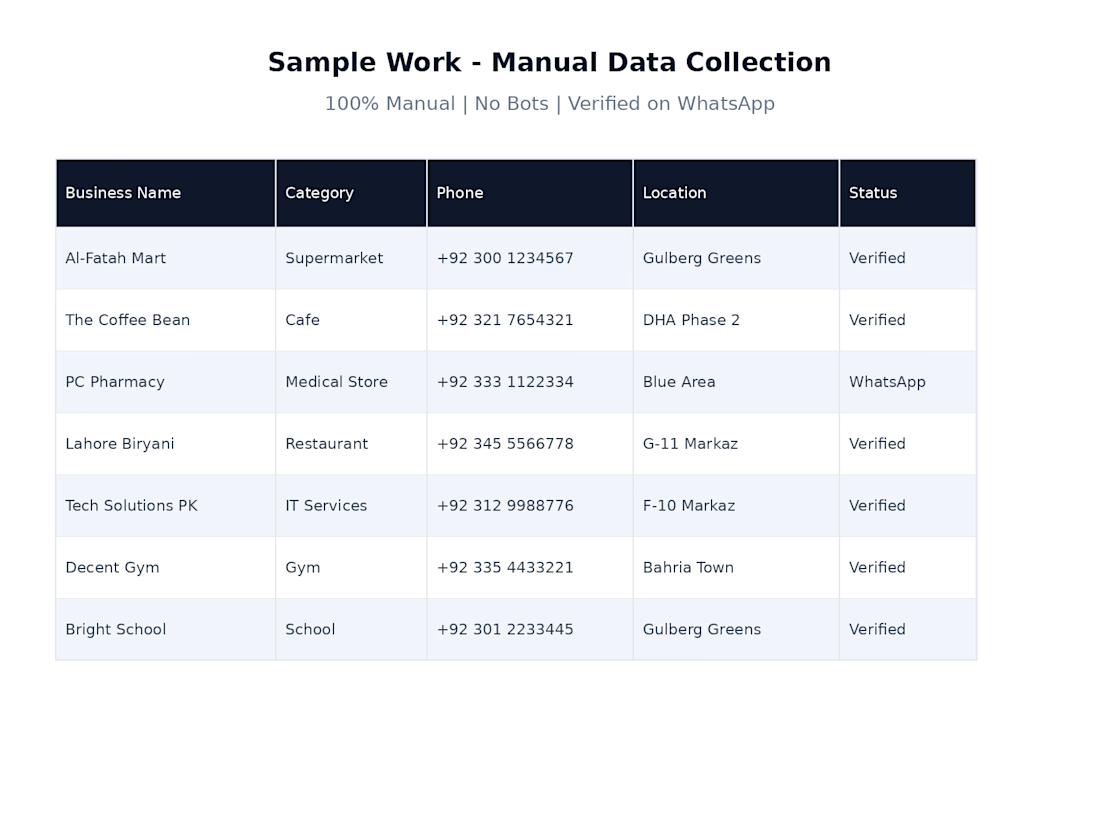
Sample of my manual business data collection work using Google Maps. I verified business details and organized the information into a clean, structured Excel sheet for marketing and lead generation.


Hello is there any #Dataentry jobs available?

Count each minute once before looking for a bottleneck.
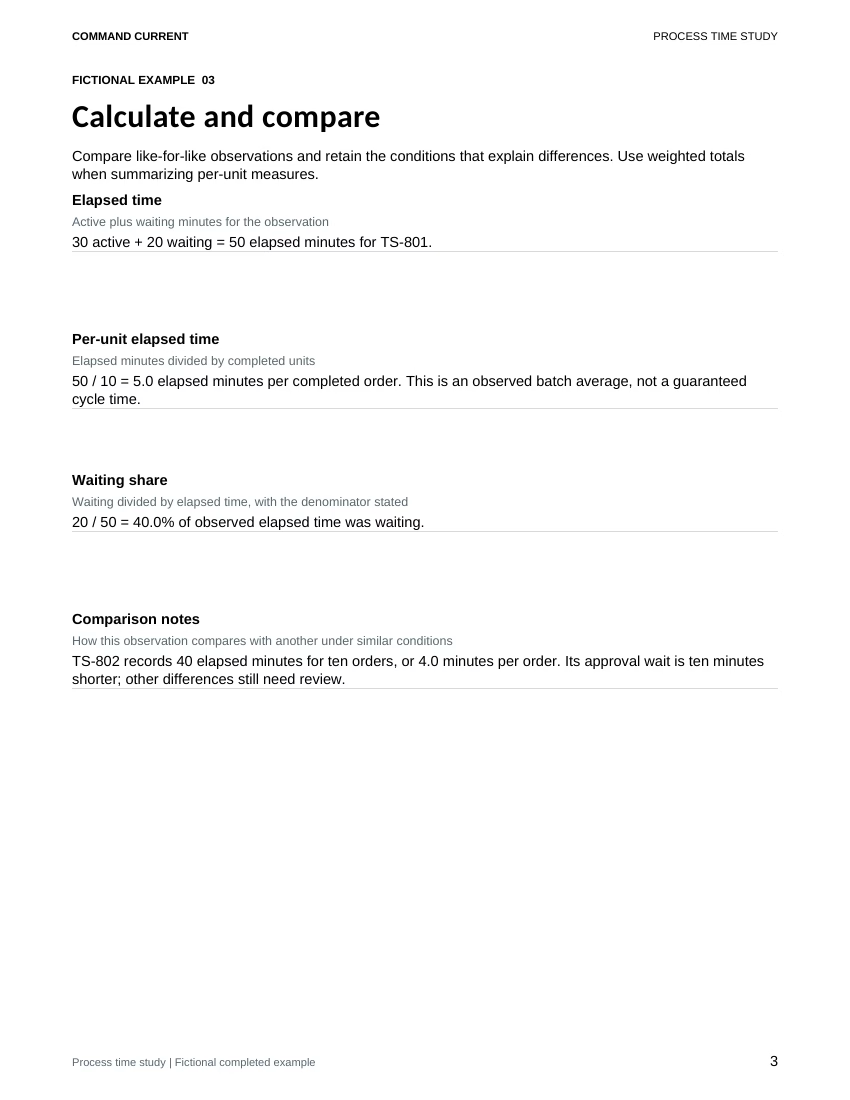
In this kit's fictional time study, batch TS-801 has 30 active minutes, including 4 minutes correcting labels, plus 20 minutes waiting for approval. Ten orders are completed.
That gives 50 elapsed minutes, 5.0 minutes per completed order and a 40% waiting share. The 4 rework minutes are already inside active time. Adding them again would overstate the observation.
Try this on one repeatable process:
• Define the start, finish and what counts as a completed unit before timing
• Record active and waiting minutes separately, with rework kept inside active time
• Follow the waiting evidence to its dependency. Here, the batch is waiting for label approval
• Test a small change, such as a scheduled label-file pre-check, while keeping required approvals and tracking label corrections
• Observe comparable batches again. Keep the original records and note changes in order mix before attributing a faster result to the trial
The preview is the actual Calculate and compare page from the kit's fictional completed example. The Process Time Study and Bottleneck Review Kit includes an editable Word packet, Excel tracker, matching print PDF, fictional completed example and Quick Start.
A short observation supports a process investigation. It does not establish a staffing level or an employee performance rating.

I spent $1 to test the biggest myth in Facebook Ads.
Myth: Boost Post and Real Campaign give same results.
Test Setup: $1 per day, same creative, 24 hours.
Result 1 - Boost Post:
Reach barely past own followers
No targeting control
0 link clicks tracked
Visibility only, no results
Result 2 - Real Campaign (Ads Manager):
Clear objective: Traffic
Specific audience targeting
Trackable results: Reach, Engagement, Link Clicks
$0.07 cost per result
Learning: Boosting = visibility. Campaigns = results.
This is why I never use Boost Post for restaurant clients. I use Ads Manager to get direct orders, not just likes.
Tools: Meta Ads Manager, Audience Targeting, Campaign Optimization
Want me to audit your ad account? DM "AUDIT":


Love this test! $1/day same creative 24h - clear difference. Boost Post = reach only past followers, no targeting. Real campaign = link clicks tracked. I always tell my shoe brand clients - boost is visibility only, no results. Great experiment!