The network for creativity
Join 1.25M professional creatives like you
Connect with clients, get discovered, and run your business 100% commission-free
Creatives on Contra have earned over $150M and we are just getting started
Back to feedPost
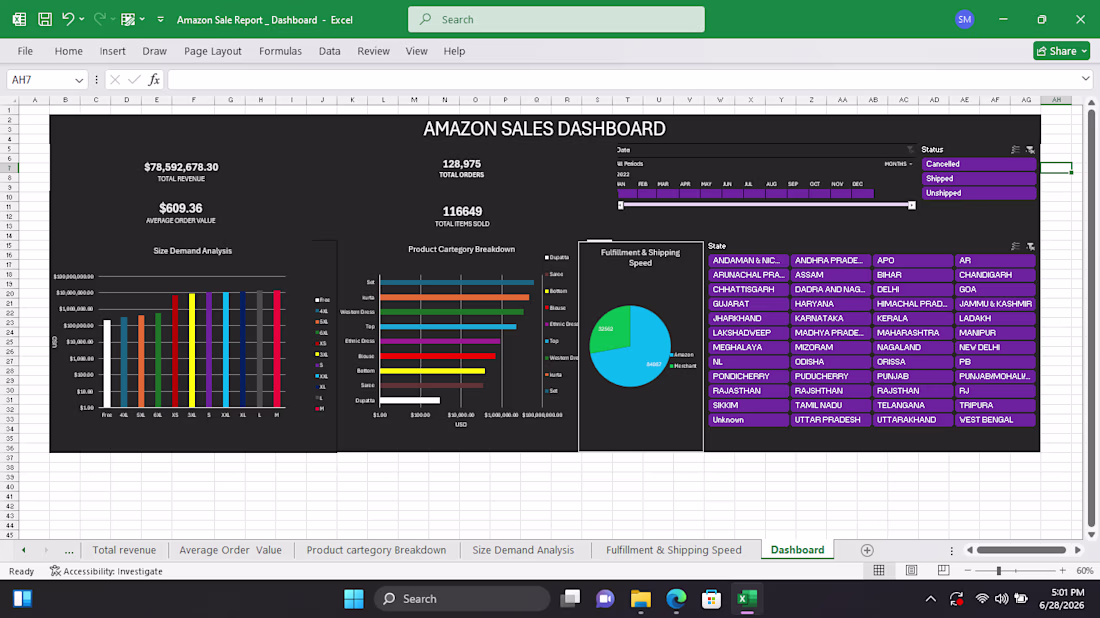
Amazon Sales Performance Dashboard
Developed a fully interactive, dynamic e-commerce dashboard inside Microsoft Excel to analyze sales trends, operational fulfillment metrics, and distribution performance for Amazon sales data.
Key Features & Analytical Breakdown:
Executive Revenue Tracking: Analyzes over $78.5M in Total Revenue, tracking 128K+ Total Orders and keeping a precise gauge on an Average Order Value of $609.36.
Product & Demand Analysis: Features localized bar charts breaking down performance by product categories and a comprehensive 'Size Demand Analysis' to track high-volume inventory movement.
Logistics & Fulfillment Operations: Built pie charts detailing Fulfillment & Shipping Speed alongside dynamic status trackers (Cancelled, Shipped, Unshipped) to spot supply chain bottlenecks.
Dynamic Slicers & State Filters: Programmed fully interactive Excel slicers to filter performance seamlessly by individual state markets.
The network for creativity
Join 1.25M professional creatives like you
Connect with clients, get discovered, and run your business 100% commission-free
Creatives on Contra have earned over $150M and we are just getting started
Related posts
I built a comprehensive sales tracking
spreadsheet for an engine oil business
that automatically tracks daily sales,
calculates profit per transaction and
labels each sales. The client can instantly see their most
profitable product, total revenue, total
costs and net profit for any period
without any manual calculations.
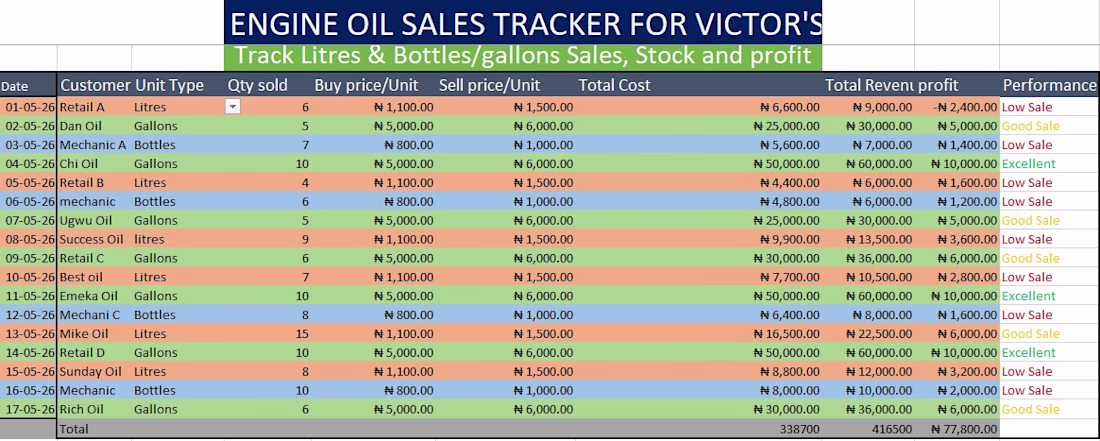
This is exactly the kind of clarity every small business owner needs — being able to see profit per transaction and top products at a glance without manual calculations is a game changer. Great work on the performance labelling too! 🙌
Sentra — AI Decision Intelligence Platform
AI platforms have a credibility problem. Everyone claims intelligence. Most websites look the same: gradient blobs, generic dashboard screenshots, vague promises. Sentra needed to feel like the product already works before you've even signed up.
The 3D wireframe spheres do the heavy lifting here. They visualize the pipeline (Raw Signals → Decision Engine → Actionable Output) without a single flowchart arrow. You read the data journey through the visuals, not despite them. The dark UI isn't an aesthetic choice, it's a trust signal. When your product processes unstructured multi-source data into confident decisions, the interface should feel like a control room, not a marketing page.
Mobile keeps the same weight. No compromises, no "lite" version. Same conviction, smaller screen.
"Clarity. Signal. Control." Three words in the footer. The design already said it.
#WebDesign #UIDesign #SaaS #AI #DataVisualization #DarkUI #ProductDesign #LandingPage #3DDesign #TechDesign

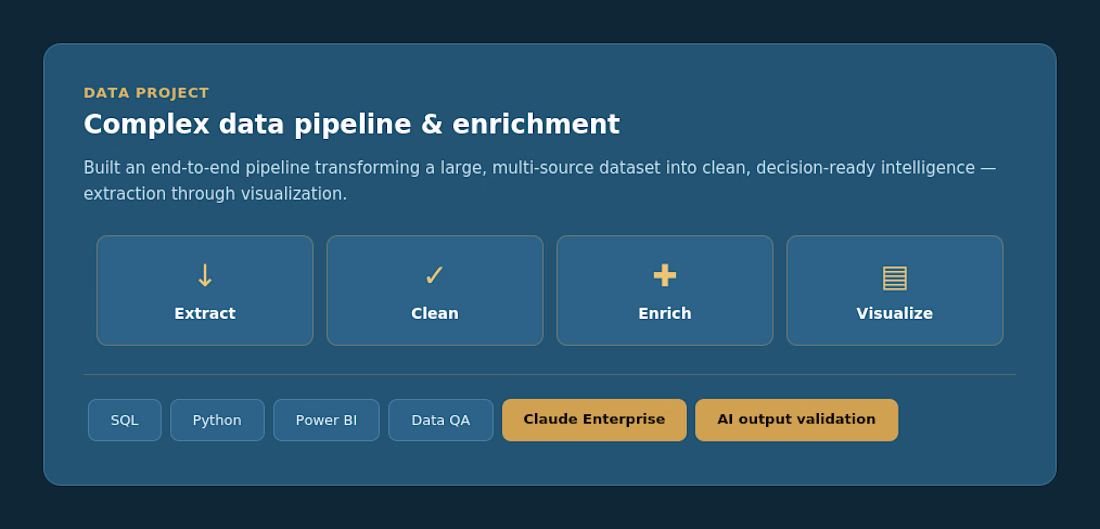
Designed and built a full data pipeline — pulling from multiple sources, resolving inconsistencies, enriching with external variables, and delivering clean outputs through interactive Power BI dashboards stakeholders can actually act on.
Designed and built a full data pipeline — pulling from multiple sources, resolving inconsistencies, enriching with external variables, and delivering clean outputs through interactive Power BI dashboards stakeholders can actually act on.
The starting point was a large, structurally complex dataset with inconsistent formats, missing values, and misaligned fields. The goal was a repeatable pipeline that transformed it into something reliable enough to drive real decisions.
The enrichment layer was the differentiator: layering in demographic and contextual variables from external sources to add depth that the raw data alone couldn't provide. The final output was a Power BI dashboard built for non-technical audiences — clear enough to act on, rigorous enough to hold up to scrutiny.
AI-assisted validation (Claude Enterprise) was used throughout to cross-check outputs and flag inconsistencies before delivery
Trending
Claude
Claude has entered the design space. How are you using Claude Design?
Contra University
Learn from expert creatives how to earn more using next-gen AI tools.
MagicPath
The canvas is infinite, and exploration is becoming the workflow. How are you using MagicPath?
creativeaiflow
Creative AI workflows are evolving. What tools do you use, and what are their strengths and weaknesses?
freelancerlife
Freelancer life is wins, pivots, and everything in between. What’s yours right now?