The network for creativity
Join 1.25M professional creatives like you
Connect with clients, get discovered, and run your business 100% commission-free
Creatives on Contra have earned over $150M and we are just getting started
Back to feedPost
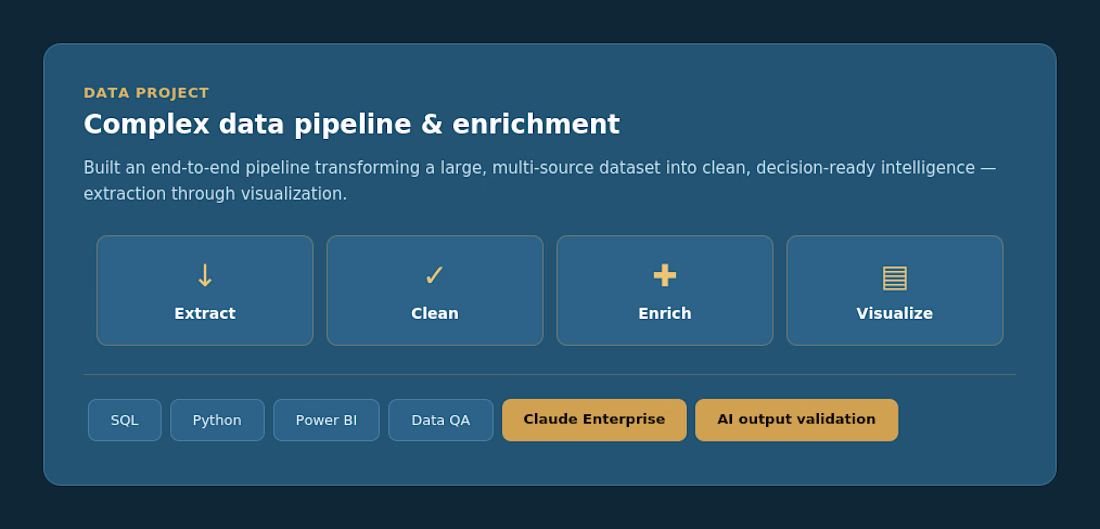
Designed and built a full data pipeline — pulling from multiple sources, resolving inconsistencies, enriching with external variables, and delivering clean outputs through interactive Power BI dashboards stakeholders can actually act on.
Designed and built a full data pipeline — pulling from multiple sources, resolving inconsistencies, enriching with external variables, and delivering clean outputs through interactive Power BI dashboards stakeholders can actually act on.
The starting point was a large, structurally complex dataset with inconsistent formats, missing values, and misaligned fields. The goal was a repeatable pipeline that transformed it into something reliable enough to drive real decisions.
The enrichment layer was the differentiator: layering in demographic and contextual variables from external sources to add depth that the raw data alone couldn't provide. The final output was a Power BI dashboard built for non-technical audiences — clear enough to act on, rigorous enough to hold up to scrutiny.
AI-assisted validation (Claude Enterprise) was used throughout to cross-check outputs and flag inconsistencies before delivery
The network for creativity
Join 1.25M professional creatives like you
Connect with clients, get discovered, and run your business 100% commission-free
Creatives on Contra have earned over $150M and we are just getting started
Related posts
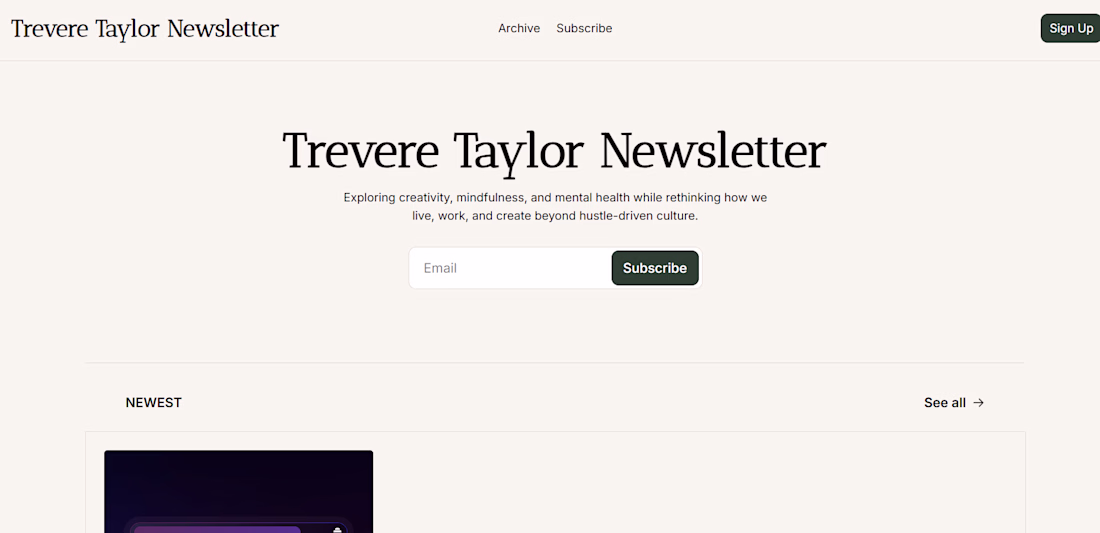
I started a newsletter. Not to build an audience. Not to sell anything. Just to have a place where I could think without packaging it.
It's called the Trevere Taylor Newsletter, and it's where I write about the stuff that actually keeps me up at night. History, psychology, love, life, art, geopolitics. Pop Culture. Star wars lol. The hardest lessons nursing ever taught me.
My content strategy work is where I build systems that move people. This is where I figure out why they move.
Not everything needs a funnel. Some things just need a window and nowhere to be.
Link attached below. Come. Pull up a chair. Grab some coffee (or tea) and enjoy.
Amazing!
Title : Customer Sales Analytics Dashboard
Description : Performed sales analysis using SQL and Excel to identify revenue trends, customer behavior, and business insights.
I've been watching Formula 1 since 2014. Through the Mercedes era, the 2021 title fight that broke my heart and rebuilt it, and the Sunday-afternoon alarms for flyaway races, F1 has been a constant for me for over a decade.
So I finally built the thing I always wanted to exist: a real-time F1 race dashboard that doesn't just show what's happening but predicts what's about to.
🏎️ What it does:
A live track map with every car moving in real time, built from real GPS data.
Live timing, tires, gaps, and pit stops.
And the part I'm most proud of: AI predictions for tire life, pit windows, safety-car risk, and where each car will actually finish
The honest results (because numbers should mean something):
Its finishing-position guess is on average within ~2 places of where a car really ends up. So if it says "P5," reality is usually P3–P7.
It gets about 3 in 4 of its podium calls right while the race is still running.
For safety cars: when it says there's roughly a 1-in-8 chance of one soon, that's about how often one actually appears, i.e., the percentages are honest, not vibes.
What I learned the hard way: in a sport this strategic, the live running order is already a brutally good predictor. Beating it isn't about more data; it's about modeling the chaos (safety cars, rain, and DNFs). That reframing was the whole project.
Built with Python, FastAPI, React, and a Monte Carlo simulation engine. Every predicted number is labelled so it's never confused with real telemetry.
From fan to builder, easily the most fun I've had with a side project. 🏁
Repo + write-up in the comments. Would love feedback from other F1 + data folks.
Trending
Claude
Claude has entered the design space. How are you using Claude Design?
Contra University
Learn from expert creatives how to earn more using next-gen AI tools.
MagicPath
The canvas is infinite, and exploration is becoming the workflow. How are you using MagicPath?
creativeaiflow
Creative AI workflows are evolving. What tools do you use, and what are their strengths and weaknesses?
freelancerlife
Freelancer life is wins, pivots, and everything in between. What’s yours right now?