The network for creativity
Join 1.25M professional creatives like you
Connect with clients, get discovered, and run your business 100% commission-free
Creatives on Contra have earned over $150M and we are just getting started
Back to feedPost
📊 Excel Sales Dashboard & Data Cleaning Project
🔍 Problem
Businesses often deal with messy, unstructured sales data (missing values, duplicates, inconsistent formats), making it difficult to generate accurate reports and insights.
⚙️ Solution
In this project, I transformed raw sales data into a clean, structured dataset and built an interactive Excel dashboard for better decision-making.
🛠️ What I Did
Cleaned and structured raw CSV data using Excel formulas and Power Query
Removed duplicates, handled missing values, and standardized formats
Created calculated columns for KPIs like Total Sales, Profit, and Growth
Built an interactive dashboard with slicers and dynamic charts
📈 Key Insights Delivered
Identified top-performing products and regions
Highlighted monthly sales trends
Enabled quick filtering for better business analysis
💻 Tools Used
Microsoft Excel
Power Query
Pivot Tables & Charts
🚀 Outcome
The final dashboard allows users to:
Track performance in real-time
Make data-driven decisions
Save hours of manual reporting effort
👉 If you need a similar dashboard or data cleaning service, feel free to reach out.
The network for creativity
Join 1.25M professional creatives like you
Connect with clients, get discovered, and run your business 100% commission-free
Creatives on Contra have earned over $150M and we are just getting started
Related posts
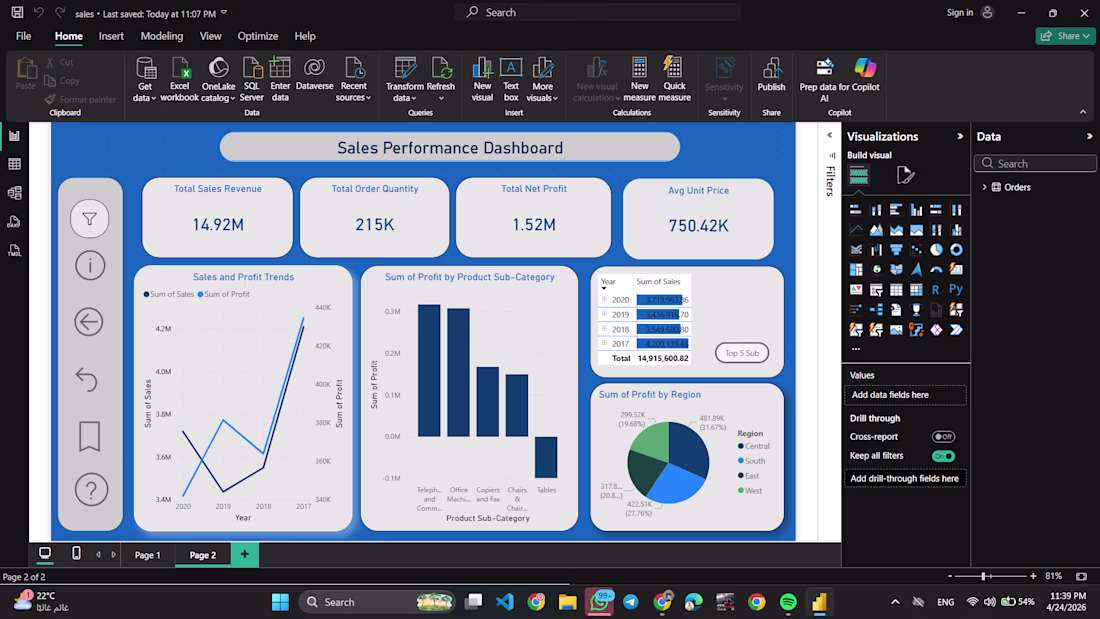
Visualizing the Full Sales Story
Data is only as good as the decisions it inspires. I built this dashboard to provide a high-level view of sales health while allowing for deep dives into specific regional performance.
Using SQL for initial data extraction and Power BI for the final visualization, I focused on creating a clean UI that highlights the most critical KPIs—total revenue and profit trends—at a glance.
great, keep it up !
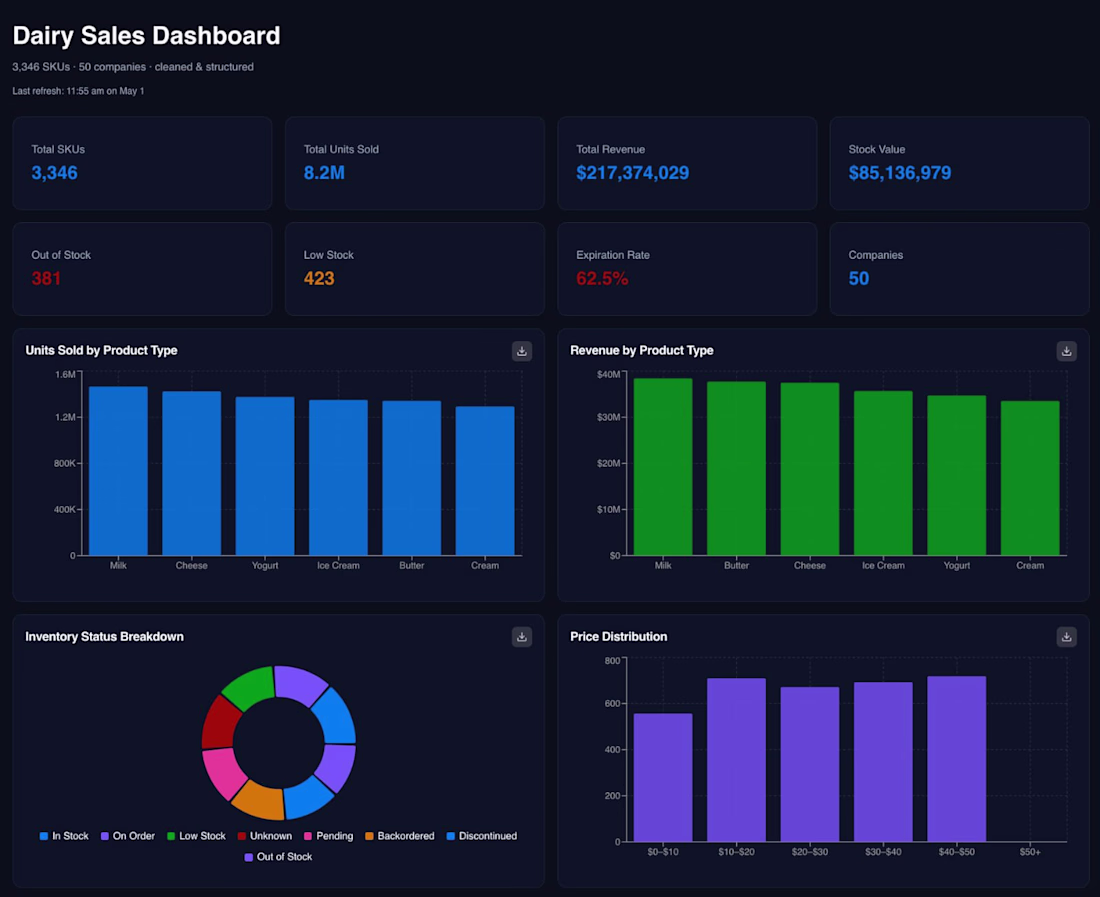
Dairy Sales Dashboard — Interactive Business Intelligence Report
Built a fully interactive sales dashboard for a dairy company dataset containing 3,346 SKUs across 50 companies, cleaned and structured from raw messy data.
What this dashboard includes:
KPI summary cards (Total Revenue, Stock Value, Units Sold, Expiration Rate)
Units Sold & Revenue breakdown by product type (Milk, Cheese, Yogurt, Ice Cream, Butter, Cream)
Inventory Status breakdown (In Stock, Low Stock, Out of Stock, Backordered, etc.)
Price Distribution analysis across price ranges
Tools & Skills used: Python, Pandas, data cleaning, data visualization, business insight generation
Business value: Helps business owners instantly spot which products are selling, which are expiring, and where inventory risks are — without touching a single spreadsheet.
nice, keep going
Real Estate Analytics Dashboard | Revalo
Designed a multi-panel property management dashboard for real estate platforms that need sales performance and listing compliance visible in one place not split across two tools.
What was delivered:
KPI cards showing Total Sales ($34,678 +8%) and Property Views (46,246 -1.8%) vs last week
Dark flow chart tracking revenue vs expenses Jan–Dec with an October peak at 435 total revenue
The fraud detection reports panel flagging 4 mismatched listings (789 Sunset Blvd, 345 Hollywood, 456 Maple Ave) with "Detected" badges.
Sales analytics bar chart showing Total Units Sold 345/500 with Total Sales vs Total Earnings breakdown Sep–Dec
Property listing table with Sold and Pending status badges and transaction dates
Built for proptech startups, real estate SaaS platforms, and marketplace operators managing large active listing volumes.
If your platform needs a dashboard that handles both performance and compliance, this is the kind of work we do.
Tools: Figma, Jitter
Let's build something better. 👋
Trending
Claude
Claude has entered the design space. How are you using Claude Design?
Contra University
Learn from expert creatives how to earn more using next-gen AI tools.
creativeaiflow
Creative AI workflows are evolving. What tools do you use, and what are their strengths and weaknesses?
portfolioreview
The best portfolios tell a story, not just show a grid. Share yours for feedback.
freelancerlife
Freelancer life is wins, pivots, and everything in between. What’s yours right now?