The network for creativity
Join 1.25M professional creatives like you
Connect with clients, get discovered, and run your business 100% commission-free
Creatives on Contra have earned over $150M and we are just getting started
Back to feedPost
Working on a SaaS dashboard concept in Figma. 🚀
The goal is to make complex business data easier to scan and understand through clear visual hierarchy, structured analytics cards, and organized navigation.
Still refining the details and exploring ways to make the experience more intuitive.
What matters more to you in a dashboard: clean visuals or faster access to insightful?
#Ui designs #Ux design #Saas design #Figma
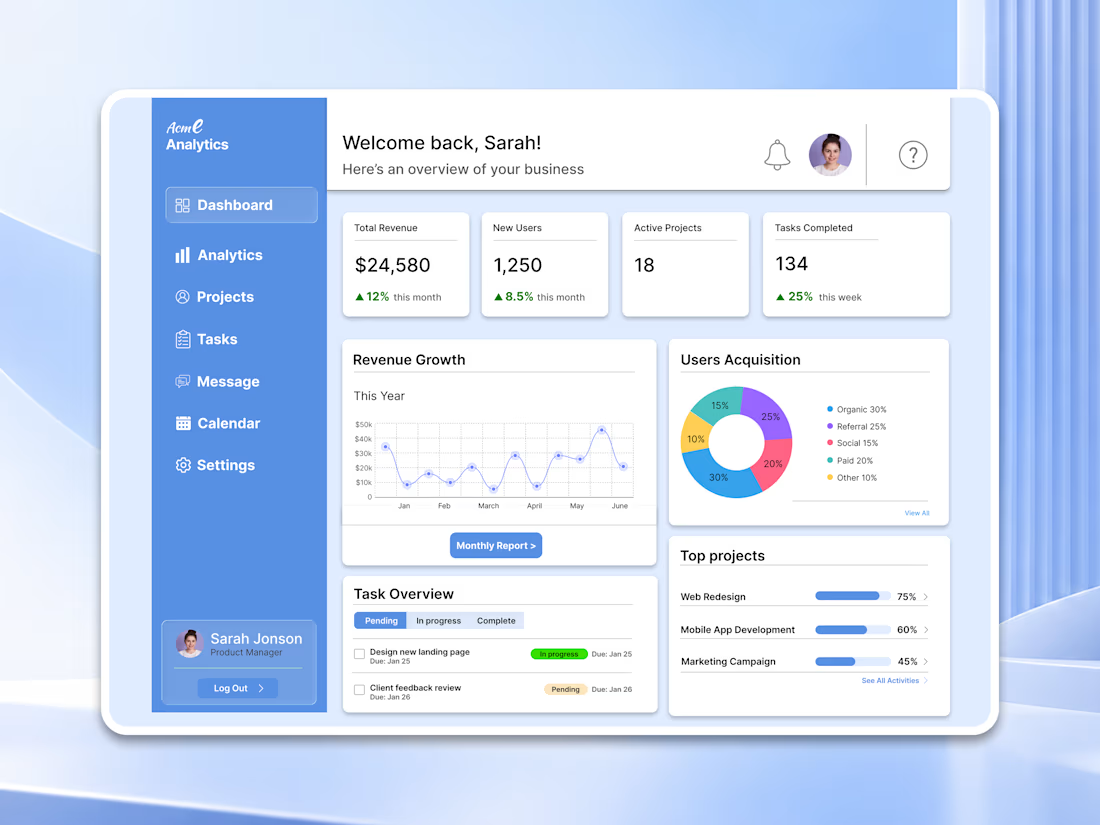

For a dashboard like this, I’d test whether the key action stays visible when the cards are filled with real, uneven data—not just placeholder numbers. What kind of business data are you designing the first view around?

Thanks for the feedback, Azizxon! The first view is built around a SaaS/agency-style business: revenue, new users, active projects and task progress. You're right that I only used clean placeholder data. Next I'll test edge cases like large values (e.g. $1,393,870), zero or...
The network for creativity
Join 1.25M professional creatives like you
Connect with clients, get discovered, and run your business 100% commission-free
Creatives on Contra have earned over $150M and we are just getting started









Related posts

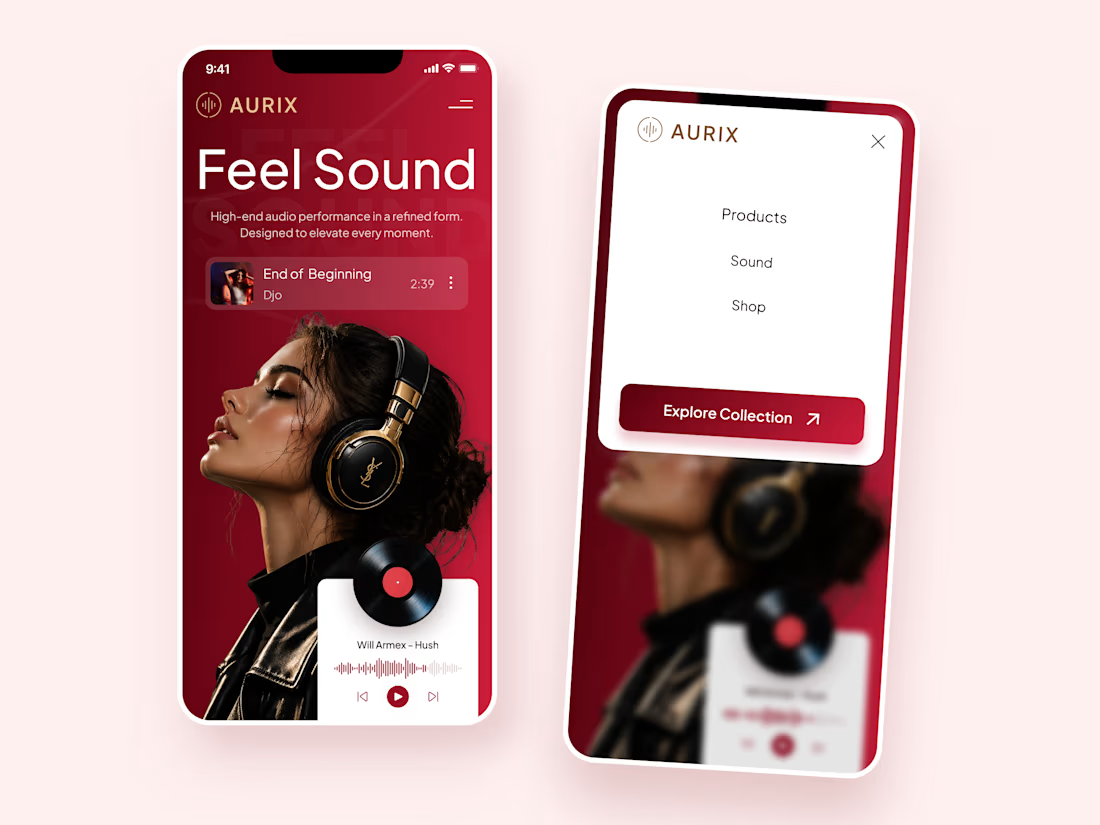
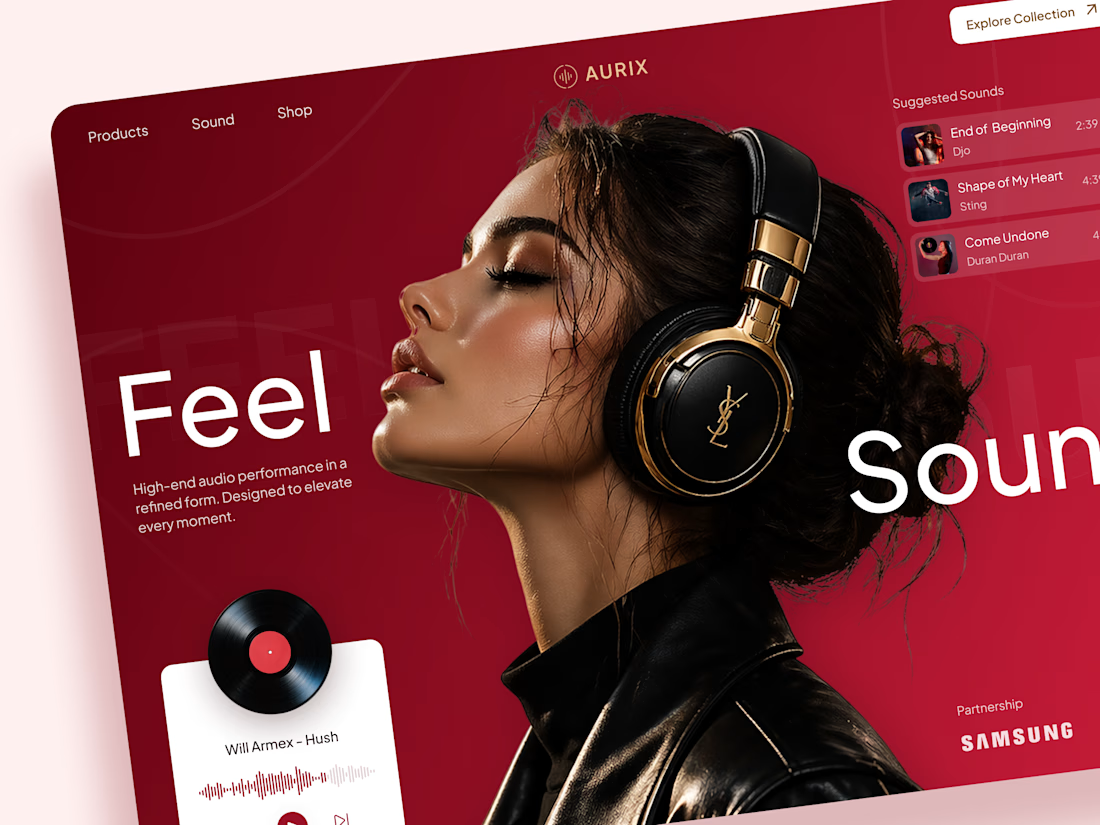
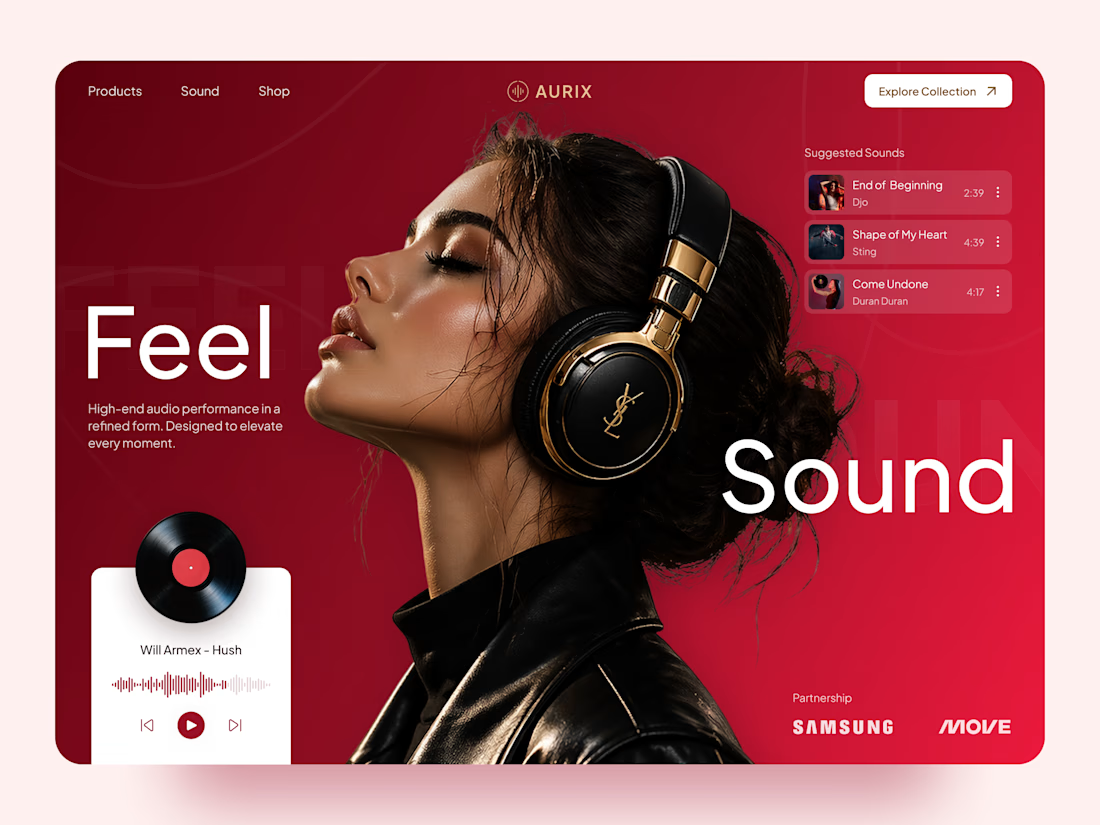
AURIX — Premium Headphones Landing Page 🎧❤️
A bold landing page concept for a premium audio brand, combining luxury headphones, music, and a strong lifestyle aesthetic
The design brings together deep red tones, elegant black and gold details, oversized typography, and immersive lifestyle imagery to create a modern, fashion-inspired experience
Special attention was given to:
• Bold lifestyle-focused hero composition
• Rich red and gold color palette
• Clean, oversized typography
• Music player and suggested tracks
• Premium product presentation
• Responsive mobile experience
• Minimal navigation and clear CTA
The result is a stylish, immersive landing page that connects premium audio with fashion, music, and everyday lifestyle ✨



Love the style!

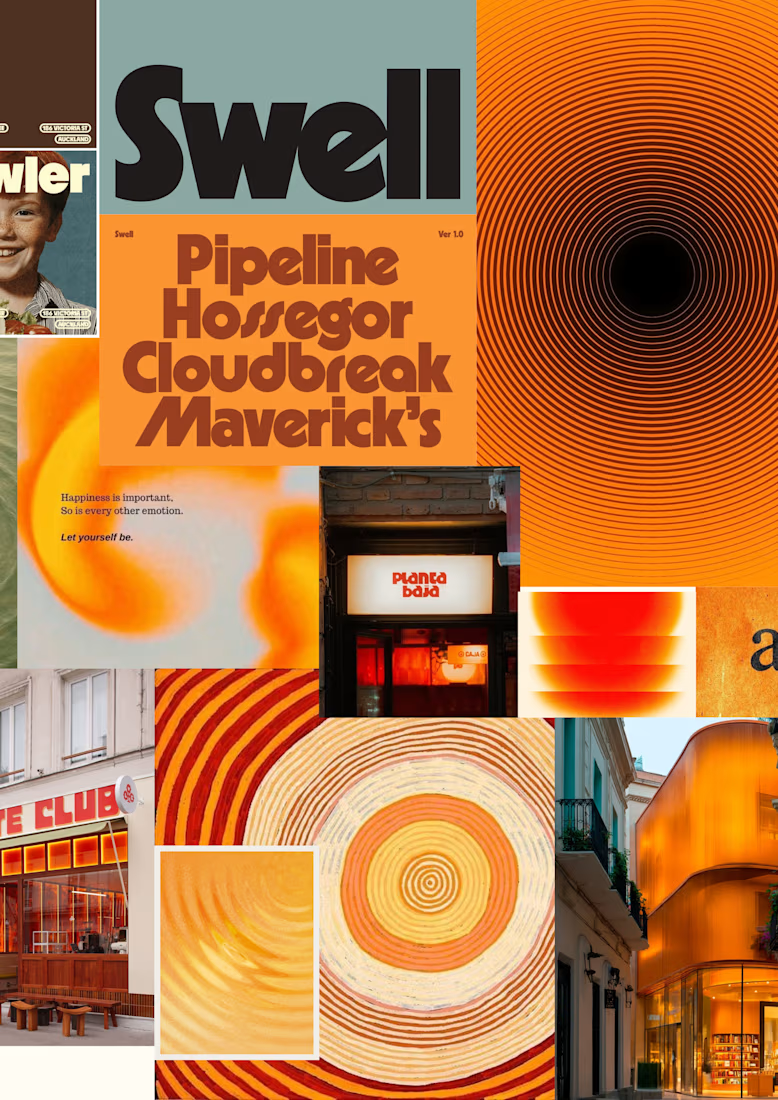
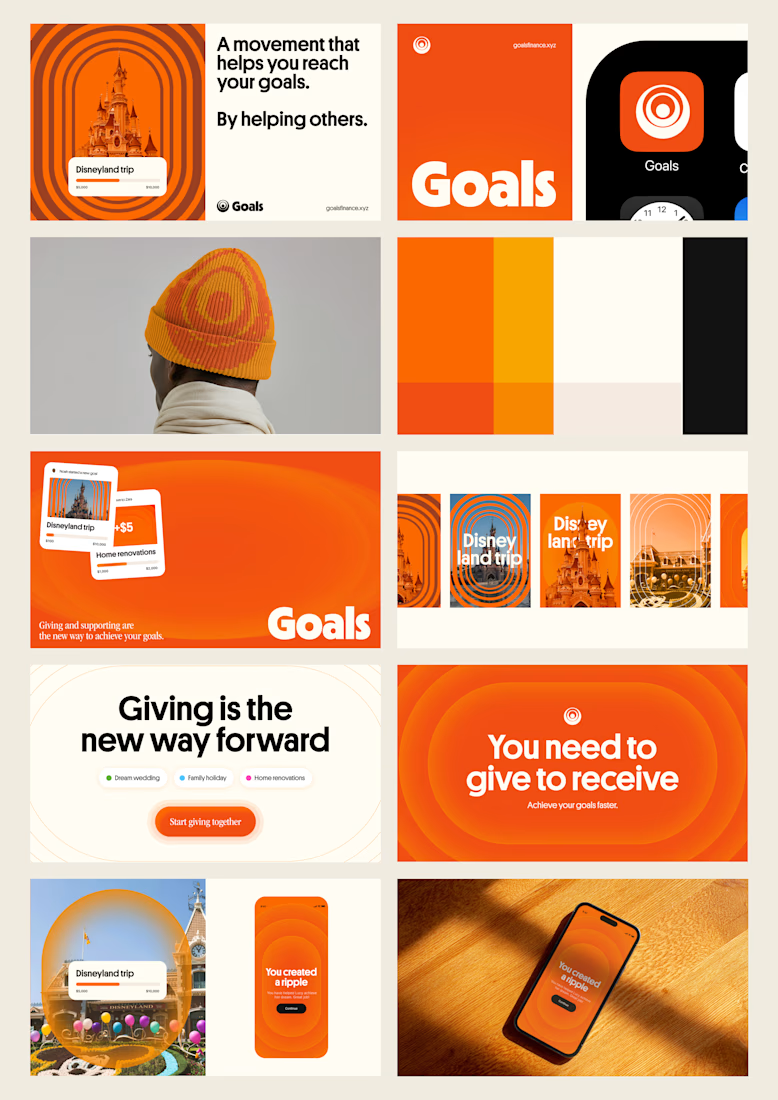
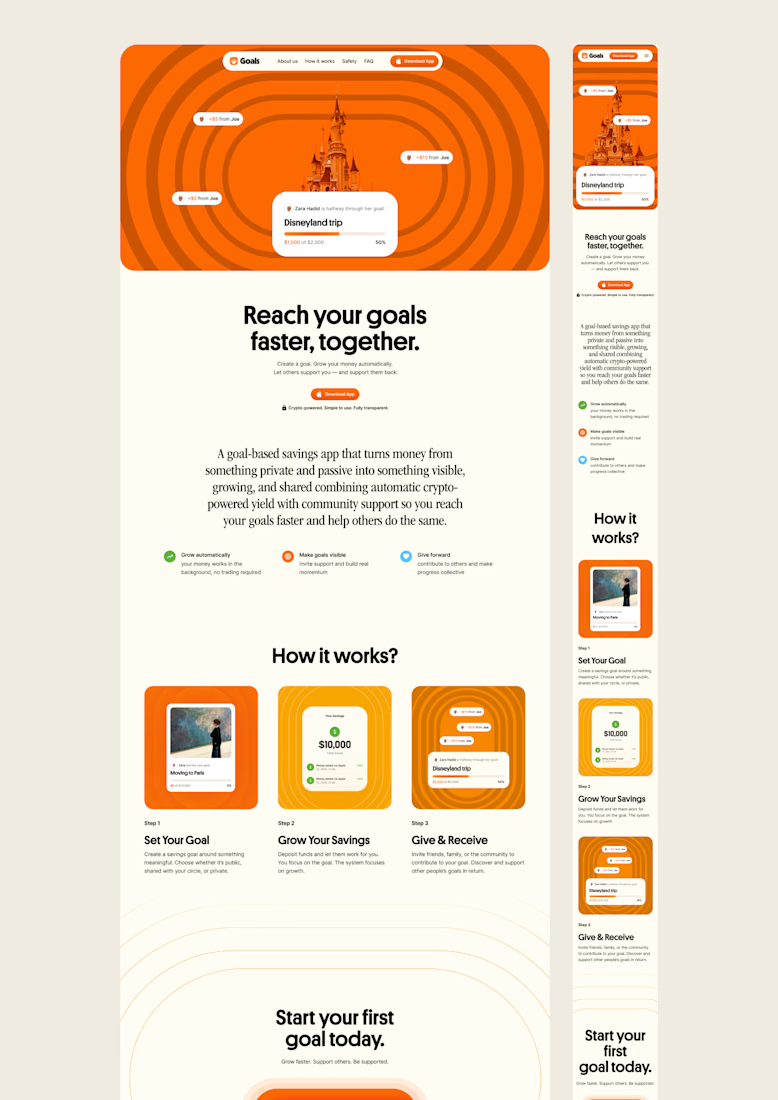
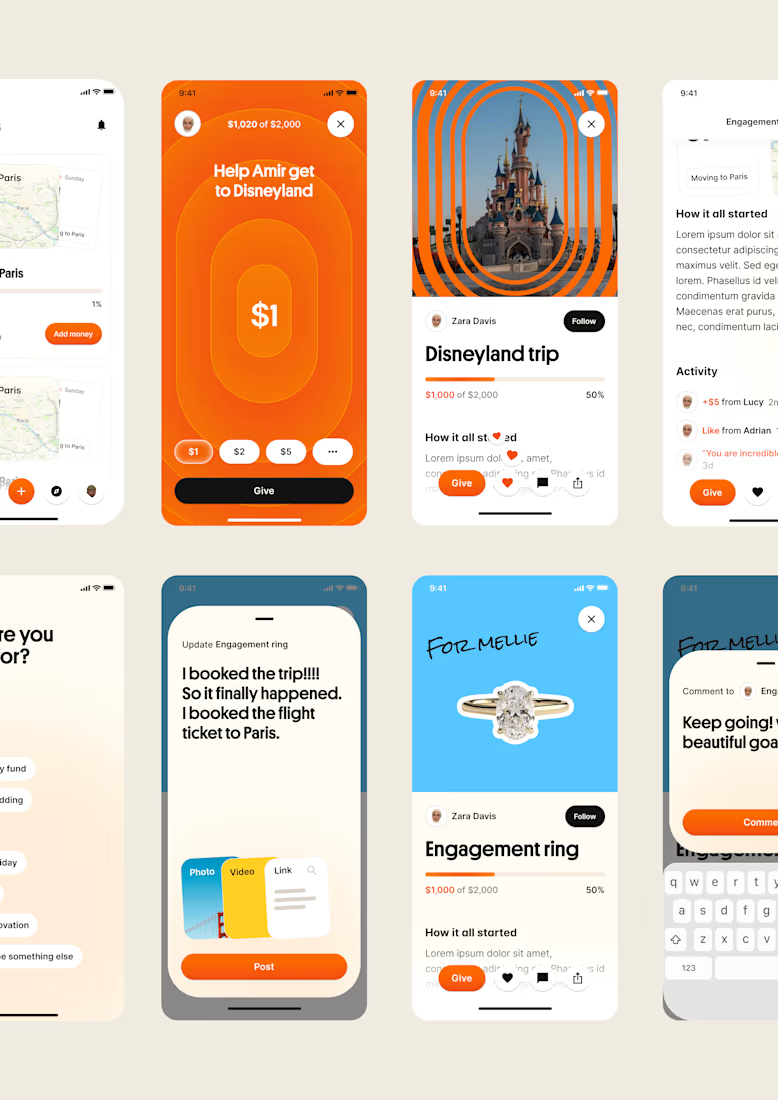
one of my favourite things about running a one-person studio is that nothing gets lost in translation.
the idea behind the brand is the same idea that shapes the website and the product.
no handovers, no starting from scratch, no trying to explain the vision to someone new.
a little look at how that came together for goals, from the first moodboard to the app ↓

Love it!


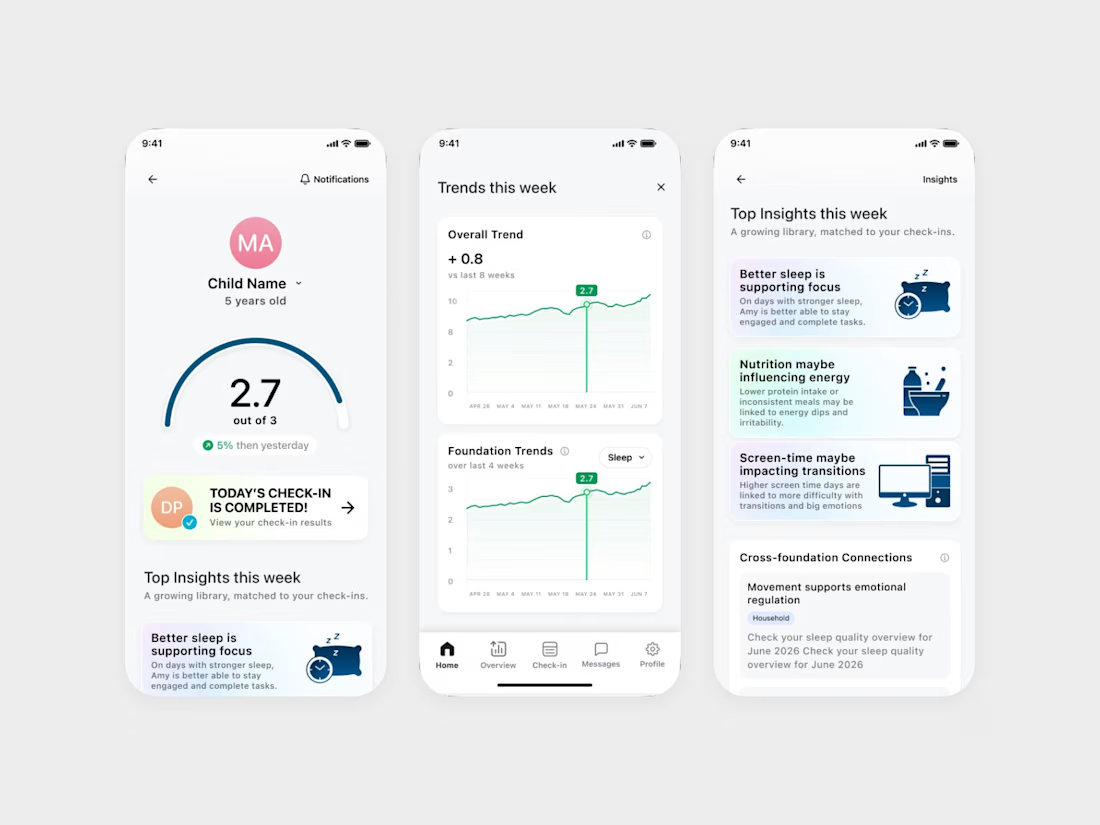
We designed an ADHD app that keeps the word ADHD off its daily screens.
It's Coastal Neuro Group's parent app. The everyday screens use words like attention, focus and regulation, and the ADHD framing stays in onboarding.
Ami Hansji, the founder, then used the same rule for the patient headers in the practitioner portal.

love this framing rule. keeping adhd in onboarding only makes it feel less clinical day to day. smart