The network for creativity
Join 1.25M professional creatives like you
Connect with clients, get discovered, and run your business 100% commission-free
Creatives on Contra have earned over $150M and we are just getting started
Back to feedPost

☕ CoffeePedia – A Power BI dashboard that's actually fun!
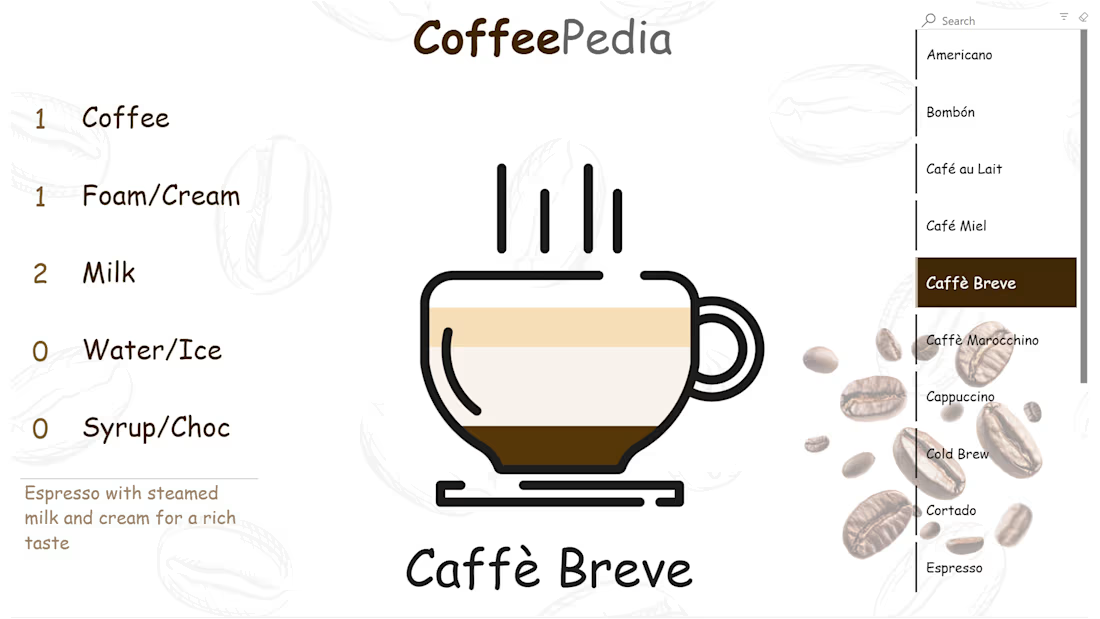
What if exploring coffee recipes felt like looking inside a cup?
With CoffeePedia, pick your favorite coffee drink and discover how it's made. Each recipe is visualized as layers inside a cup – coffee, milk, foam, syrup, and more – with exact proportions.
A little experiment with non-standard data visualization, proving that Power BI can be much more than just bar charts!
Interested in building something similar? I also offer 1:1 Power BI sessions in English and Arabic.

The network for creativity
Join 1.25M professional creatives like you
Connect with clients, get discovered, and run your business 100% commission-free
Creatives on Contra have earned over $150M and we are just getting started



Related posts

Dark or Light? Which dashboard design do you prefer?
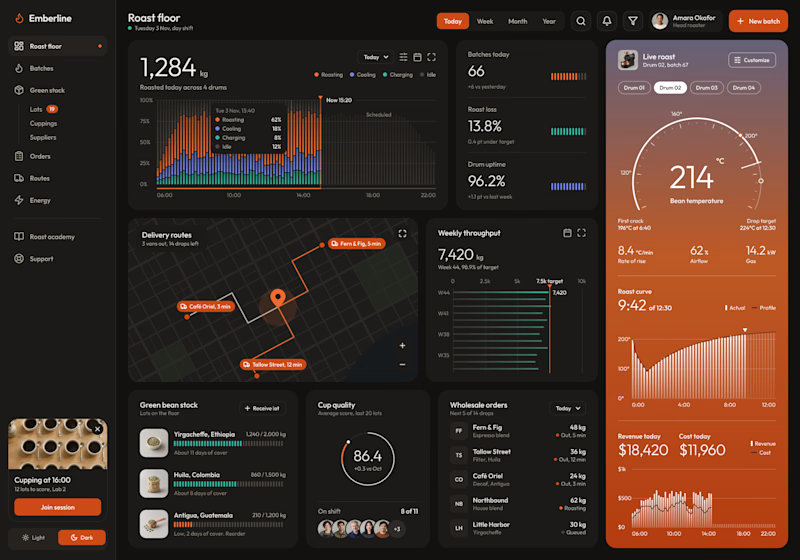
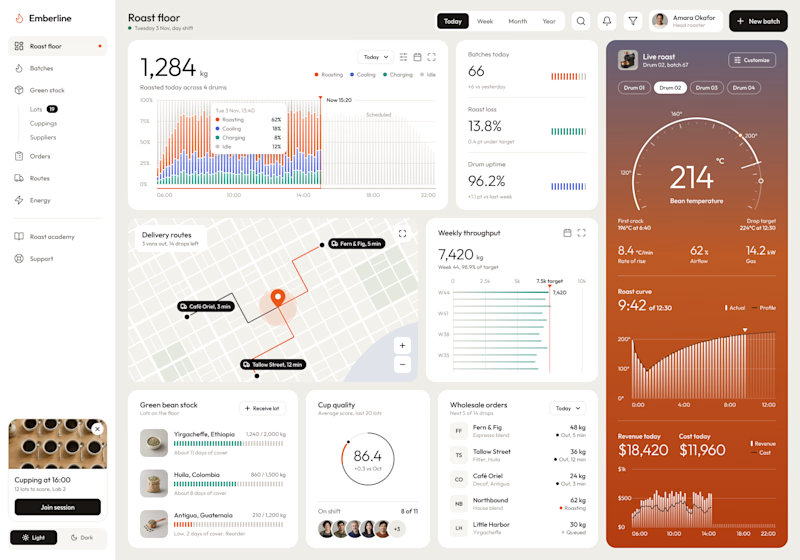
I designed a production dashboard for a coffee roasting business in two themes, and I'd love your opinion! 🖤🤍
It brings everything into one view: live roast tracking, batch stats, delivery routes, weekly throughput, green bean stock, cup quality scores, wholesale orders, and daily revenue.
Both versions share the same layout and warm orange accents, but each creates a very different feel:
Option 1: Dark mode – Bold, focused, and easy on the eyes during long shifts.
Option 2: Light mode – Clean, bright, and airy with a modern minimal look.
Which one would you choose for your daily workflow? Vote and share why in the comments!

5 voted
63%
3 voted
37%
8 votes
Closed

The orange and black looks really good, and give me the sensation of Focus, Awesome

Crypto Portfolio Dashboard
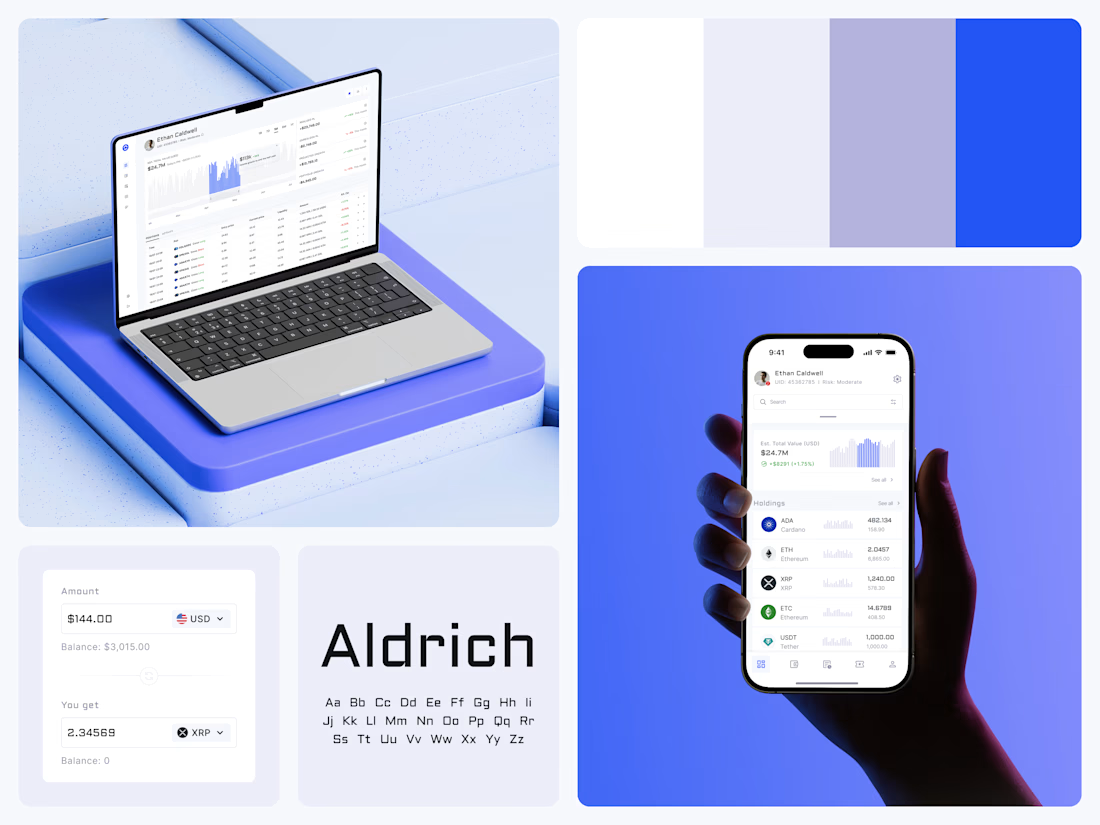
Blue means one thing here: the range you are looking at.
The value chart is a row of thin gray bars, and only the selected date range fills in blue. You read the period that matters and keep the months around it as context.
The phone carries the same chart above the holdings list. Each coin gets its own small bar chart between the name and the amount, so you can scan the whole portfolio for movement without opening a single coin.
Trading screens get busy fast. This one stays light and calm, so the numbers lead: total value, realized and unrealized P&L and open positions, all on one screen.
Designed by the Hue & Machine team.
#Crypto #Fintech #DashboardDesign #TradingPlatform #DataVisualization #UIDesign #ProductDesign #WebApp #MobileDesign #FigmaDesign



Nice Ui Dmytro

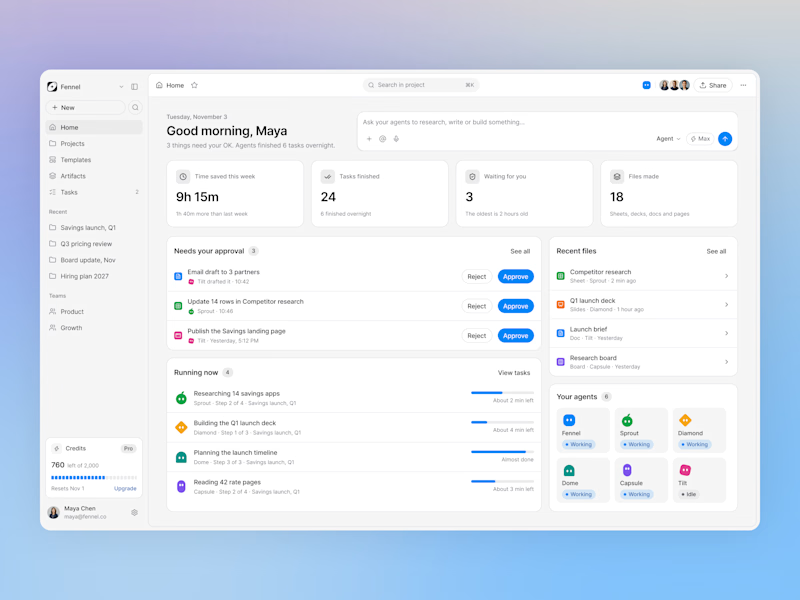
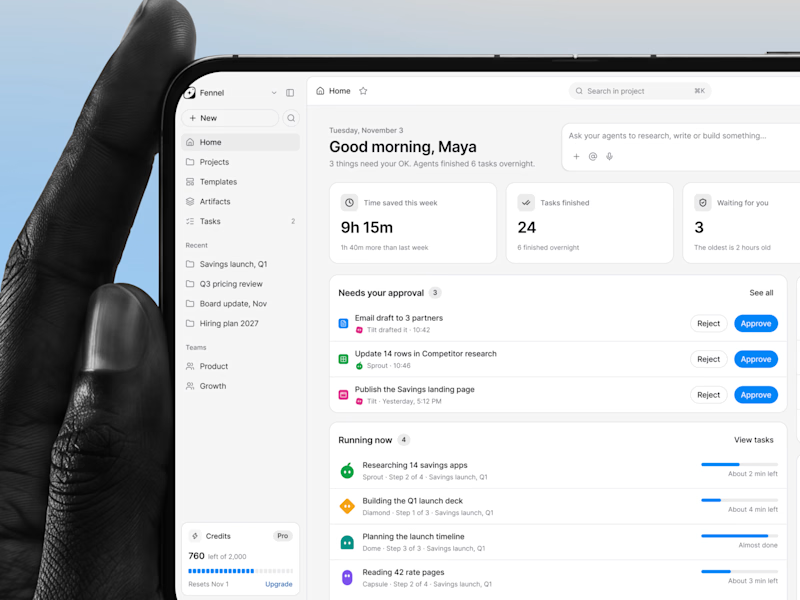
Designed an AI agents dashboard where you approve work, track running tasks, and see your whole team of agents in one place.
Same screen, two shots. Which one would stop your scroll? 👀


1 voted
50%
1 voted
50%
2 votes
Closed

nice one dude