The network for creativity
Join 1.25M professional creatives like you
Connect with clients, get discovered, and run your business 100% commission-free
Creatives on Contra have earned over $150M and we are just getting started
Back to feedPost

Crypto Portfolio Dashboard
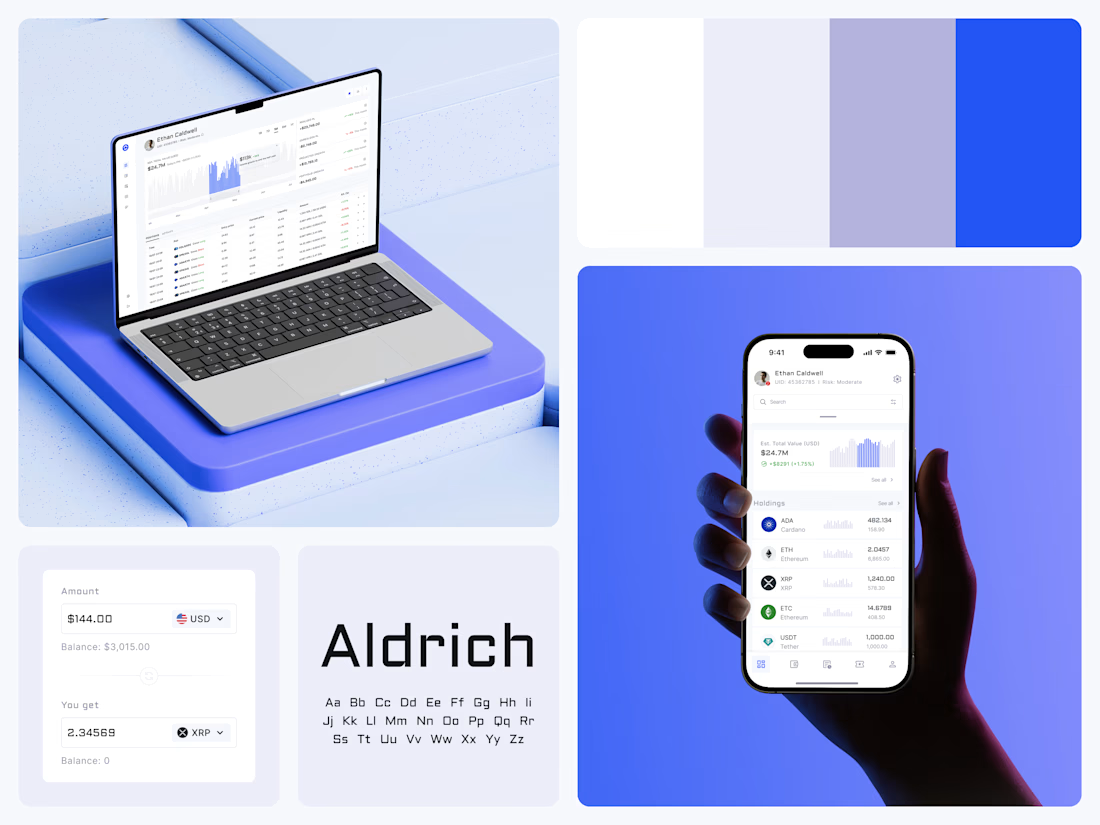
Blue means one thing here: the range you are looking at.
The value chart is a row of thin gray bars, and only the selected date range fills in blue. You read the period that matters and keep the months around it as context.
The phone carries the same chart above the holdings list. Each coin gets its own small bar chart between the name and the amount, so you can scan the whole portfolio for movement without opening a single coin.
Trading screens get busy fast. This one stays light and calm, so the numbers lead: total value, realized and unrealized P&L and open positions, all on one screen.
Designed by the Hue & Machine team.
#Crypto #Fintech #DashboardDesign #TradingPlatform #DataVisualization #UIDesign #ProductDesign #WebApp #MobileDesign #FigmaDesign



Good design
Thanks, Shakil!

Good design
Thanks, Sujon!

Clear work Dmytro🔥
Thanks, Jalal!

Really clean dashboard design! Love how the selective use of blue keeps the data easy to scan without overwhelming the interface.
Thanks a lot! That was the whole idea: blue only ever marks the range you picked, and everything else stays quiet, so you see your selection before anything else. Glad it came through.

Smart work, Dmytro.
Thank you, Ezzat!

You nailed it! ❤️
Thanks! 🙌

Nice Ui Dmytro
Thanks, Anyadi!
You're welcome

Love this!
Thank you guys!

The generous spacing around the numbers gives this a surprisingly calm feel for a trading screen.
Thank you! Yeah, calm was exactly what we were going for. People spend hours on a trading screen, so we gave the numbers room to breathe and kept color to the one thing that changes. Which is the range you’re looking at.

great design
Thanks Rishabh!

Nice
Thanks Paramjeet!

Using blue only for the selected range is such a smart call. You keep the context without it fighting for attention. Clean work Dmytro.
Thanks! That was the balance I was after as the gray bars keep the whole timeline in view and blue only shows up where your attention should be. Glad it reads that way 🙌

Stunning!
Thanks Madob!

only for the selected range is a smart call. Does the gray stay readable in dark mode?
Great question! Designed this one light-only, so I haven’t tested that gray on a dark background yet. For a dark version, the gray would need to get lighter and the blue a bit brighter, so the selected range still stands out from the rest of the chart.

Great app design

Looking clean and calm.


Amazing work👏🔥🔥


Using blue only for the selected range is a clean way to keep the context without the noise. The thin gray bars make the period you care about jump out immediately.

nice ui
The network for creativity
Join 1.25M professional creatives like you
Connect with clients, get discovered, and run your business 100% commission-free
Creatives on Contra have earned over $150M and we are just getting started
Related posts




Awesome dude

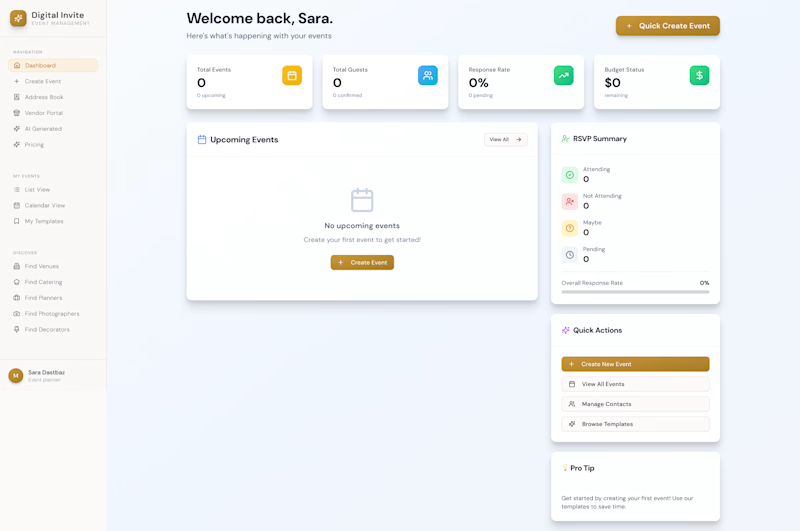
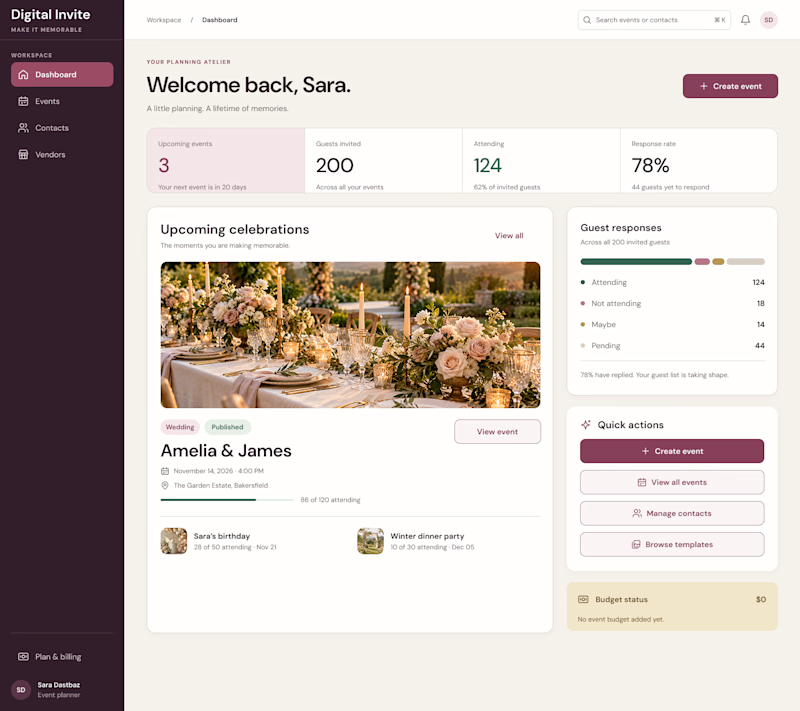
AI can generate a dashboard. But can it give a product its own identity?
The first design was created by my client using AI a familiar dashboard style you've probably seen across countless AI-generated products.
I redesigned it to feel less generic and more intentional, with a distinctive visual identity, clearer hierarchy, and an experience built around meaningful celebrations.
The goal wasn't just to make it look better. It was to make it feel like its own product.
What do you think is missing from most AI-generated interfaces?
#ProductDesign #UIDesign #AI
5 voted
23%
17 voted
77%
22 votes
Closed

I think personality is what makes a product stand out. A clean design is good, but it should also feel unique and memorable. 👏

Left aligned for me. With that much body copy next to the headline it reads cleaner.