

Pick a coffee, see how it's made.
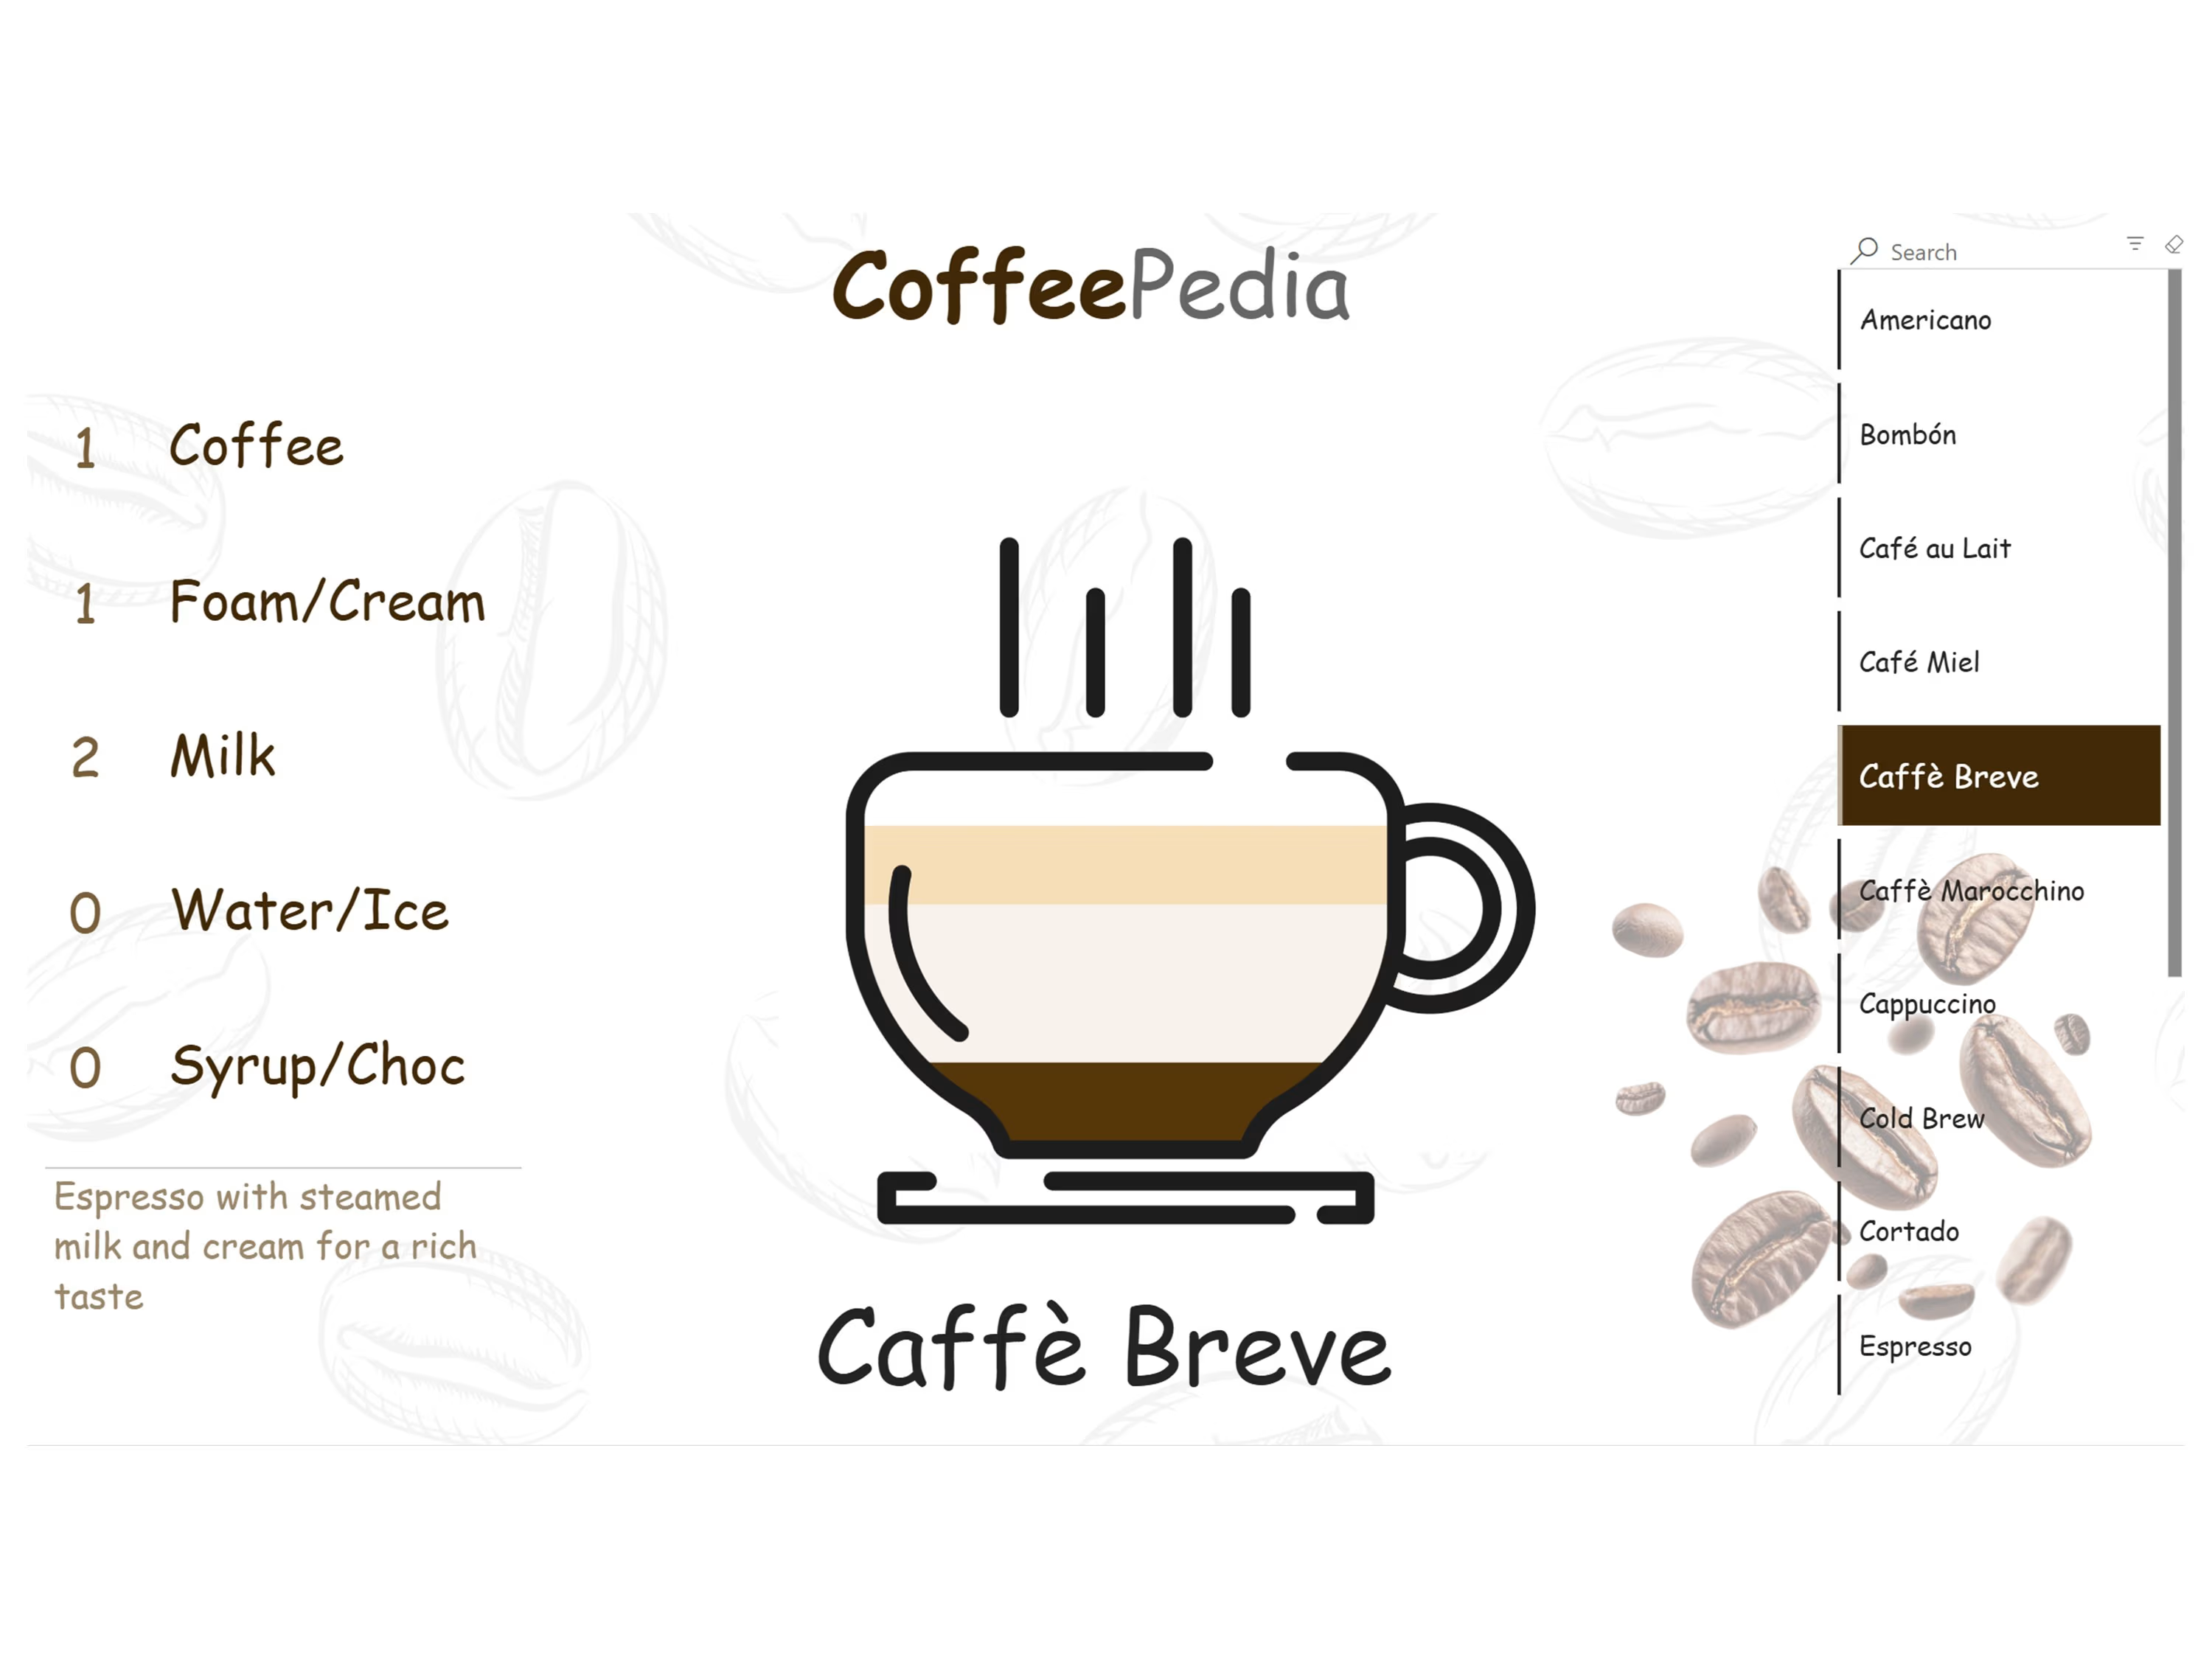
CoffeePedia is a playful Power BI dashboard that shows each coffee drink as layers in a cup – coffee, milk, foam/cream, water/ice and syrup/chocolate – with the exact proportions and a short recipe note.
What you get
• CoffeePedia.pbix – ready to open in Power BI Desktop
• Sample data in Excel – add or edit drinks yourself
Why you'll like it
• A creative, non-standard visual that stands out in a portfolio or a training session
• Fully editable – learn how it's built and reuse the idea for your own data
Requirements: Power BI Desktop (free, Windows)
Get it for$12.30
Dashboard only
$12.30
CoffeePedia Power BI file (.pbix) and sample Excel data. Instant download.
Tags
Microsoft Power BI

Data Visualizer
Product created by
Naji El Kotob Mount Lebanon Governorate, Lebanon
- 1
- Followers
Get it for$12.30
Dashboard only
$12.30
CoffeePedia Power BI file (.pbix) and sample Excel data. Instant download.
Tags
Microsoft Power BI
Data Visualizer
Pick a coffee, see how it's made.
CoffeePedia is a playful Power BI dashboard that shows each coffee drink as layers in a cup – coffee, milk, foam/cream, water/ice and syrup/chocolate – with the exact proportions and a short recipe note.
What you get
• CoffeePedia.pbix – ready to open in Power BI Desktop
• Sample data in Excel – add or edit drinks yourself
Why you'll like it
• A creative, non-standard visual that stands out in a portfolio or a training session
• Fully editable – learn how it's built and reuse the idea for your own data
Requirements: Power BI Desktop (free, Windows)
$12.30