The network for creativity
Join 1.25M professional creatives like you
Connect with clients, get discovered, and run your business 100% commission-free
Creatives on Contra have earned over $150M and we are just getting started
Back to feedPost
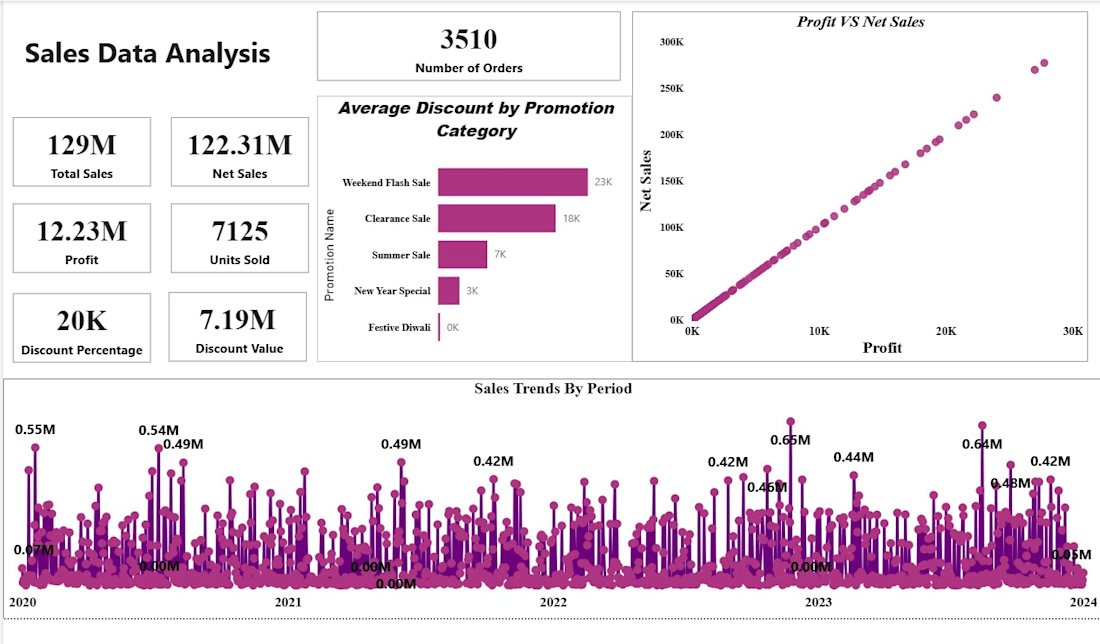
Sales Data Analysis Dashboard
This project focuses on analyzing retail sales performance using an interactive dashboard built with Microsoft Power BI.
The goal of this dashboard is to help businesses quickly understand their sales performance, profit trends, and the impact of promotional campaigns on revenue.
Dashboard Features
• Sales performance overview with key KPIs
• Profit vs Net Sales relationship analysis
• Average discount analysis by promotion category
• Time-based sales trend analysis from 2020–2024
• Visual comparison of different promotional campaigns
Business Value
This dashboard enables stakeholders to:
• identify high-performing promotions
• monitor profit and revenue trends
• track sales performance over time
• make data-driven business decisions
Tools Used
• Microsoft Power BI
• Microsoft Excel
The network for creativity
Join 1.25M professional creatives like you
Connect with clients, get discovered, and run your business 100% commission-free
Creatives on Contra have earned over $150M and we are just getting started
Related posts
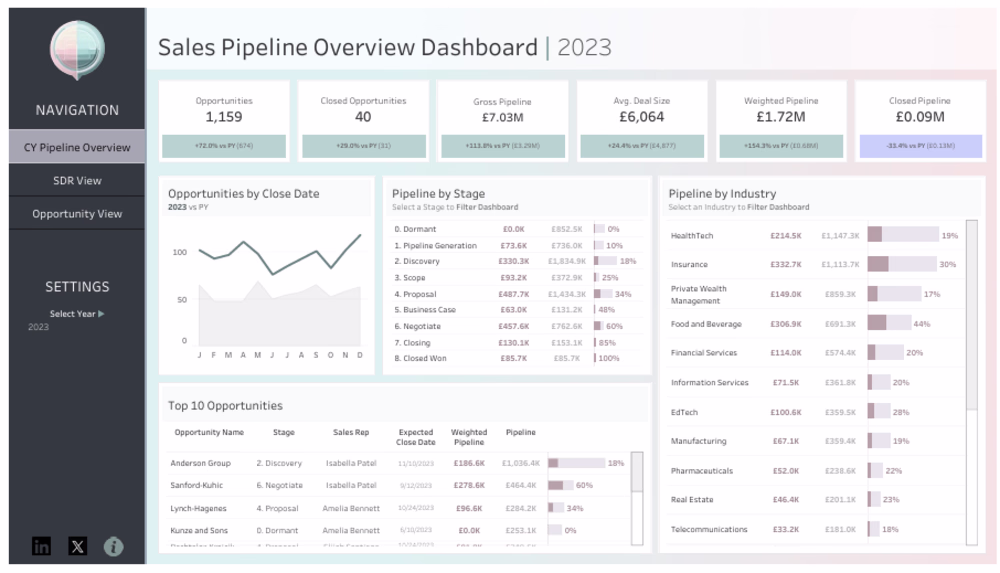
Sales Pipeline Dashboard – Tableau
Struggling to track your sales pipeline and forecast revenue accurately? This dashboard gives you a clear, real-time view of your entire sales funnel, helping you stay on top of opportunities and close deals faster.
What You Get
A centralized Tableau dashboard that brings together pipeline value, deal stages, and performance metrics into one intuitive view. No more scattered reports — everything you need is in one place.
Key Capabilities
Track total opportunities and closed deals
Monitor gross pipeline and weighted pipeline value
Analyze pipeline by sales stage to identify bottlenecks
Compare pipeline performance across industries
View top opportunities and deal progress
Understand average deal size and close trends
Why It Matters
Without visibility into your pipeline, it’s easy to miss opportunities and misjudge forecasts. This dashboard helps you identify stuck deals, improve conversion rates, and predict revenue more accurately.
Perfect For
Sales teams and managers
B2B companies
Startups scaling their sales process
Agencies managing multiple clients
Let’s Build Yours
If you want a high-impact Tableau dashboard that turns your sales data into actionable insights, I can create a custom solution tailored to your business.
looks great
Most AI dashboards look like they were built for engineers who already understand everything.
Botrix was built for the person responsible for everything and who needs to see it all in one place.
12 automations running. 8 apps connected. 2 active servers. 98% success rate. Four numbers. Full operational picture. No clicking around.
So I designed the Botrix AI Command Center to feel less like a monitoring tool and more like a control room that actually respects your time.
A soft warm canvas with orange and blue agent activity lines that make peak performance visible at a glance. The +24.11% agent execution spike isn't buried in a report; it surfaces as a live tooltip right on the chart at the moment it matters. The server status panel shows Singapore running at 42% CPU, 68% RAM, and 124GB bandwidth with Restart, SSH, and Scale actions one click away. The New York backup node shows Stopped in red, immediately, with no digging required.
The Live Activity Feed filters by All, Success, Failed, and Paused so nothing hides behind a green average. The connected tools panel shows OpenAI active and Stripe ready to toggle the entire integration layer visible without opening a settings page.
The goal was clear:
See everything. Act immediately. Trust the system.
Because when AI agents are running your business, the dashboard can't afford to be the bottleneck.
Designed by Orbix Studio.
#AIDashboard #AgentMonitoring #UIDesign #DashboardUI #ProductDesign #SaaSDesign #AITools #OrbixStudio
Nice work
This project was executed through the use of Microsoft excel, it shows trends and metrics of Air crashes from inception till date
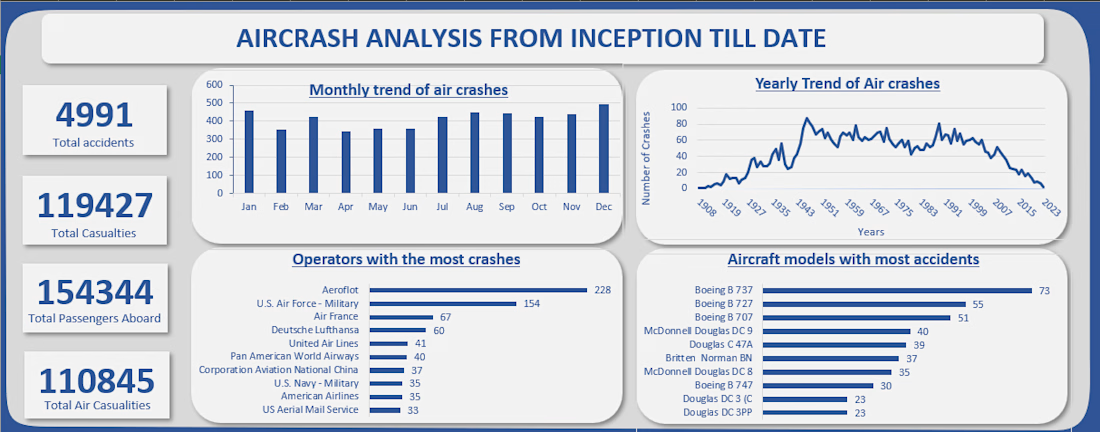
The yearly trend line is the most telling part of this dashboard — you can clearly see the peak in the 1970s and the steady decline after that, which tells a story about how aviation safety has improved over decades without needing a single word of explanation.
The operator...
Trending
Runway
AI video generation is exploding. What are you dreaming up in Runway?
Contra University
Learn from expert creatives how to earn more using next-gen AI tools.
creativeaiflow
Creative AI workflows are evolving. What tools do you use, and what are their strengths and weaknesses?
portfolioreview
The best portfolios tell a story, not just show a grid. Share yours for feedback.
freelancerlife
Freelancer life is wins, pivots, and everything in between. What’s yours right now?