The network for creativity
Join 1.25M professional creatives like you
Connect with clients, get discovered, and run your business 100% commission-free
Creatives on Contra have earned over $150M and we are just getting started
Back to feedPost
This project was executed through the use of Microsoft excel, it shows trends and metrics of Air crashes from inception till date

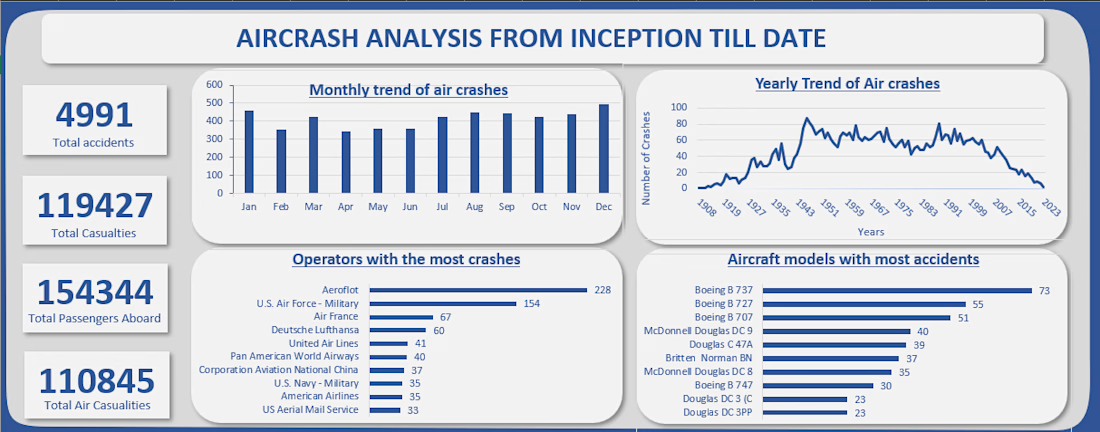

The yearly trend line is the most telling part of this dashboard — you can clearly see the peak in the 1970s and the steady decline after that, which tells a story about how aviation safety has improved over decades without needing a single word of explanation.
The operator...

thank you!, the dataset was publicly available

great job 👌
The network for creativity
Join 1.25M professional creatives like you
Connect with clients, get discovered, and run your business 100% commission-free
Creatives on Contra have earned over $150M and we are just getting started





Related posts

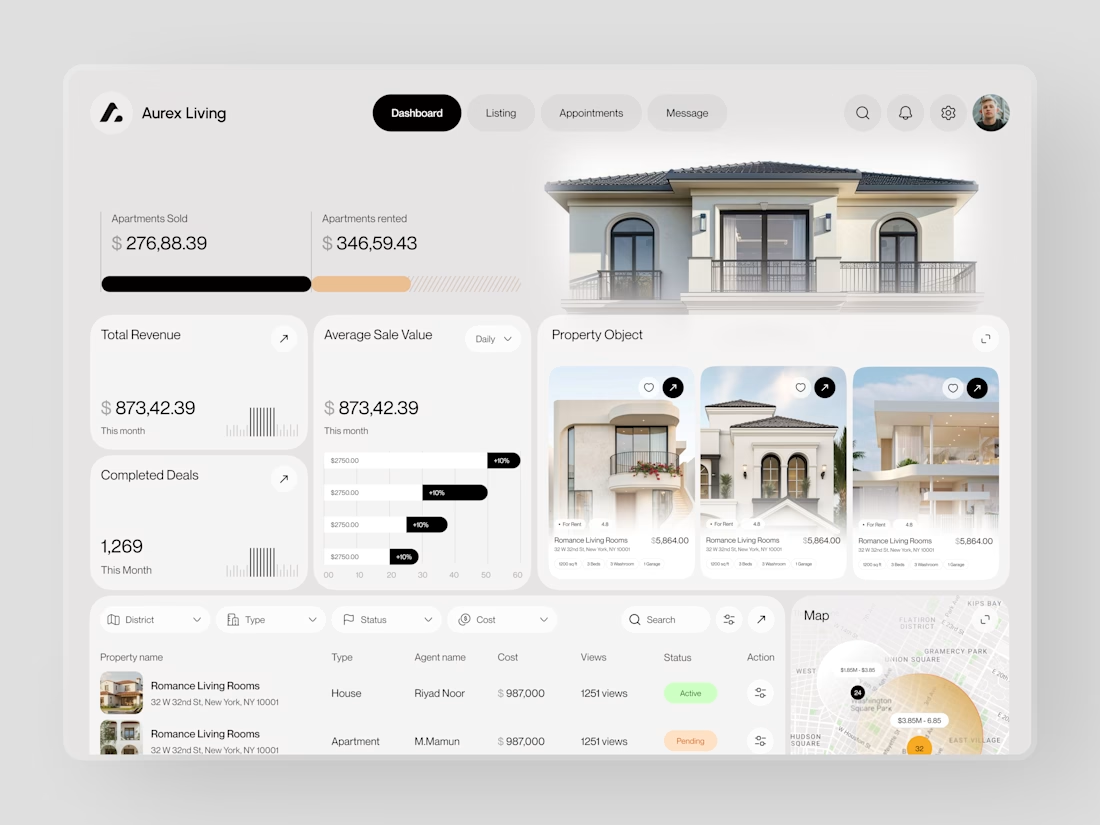
Real estate dashboards are usually built for data entry. Aurex Living was built for decision-making.
$873,42.39 total revenue. 1,269 completed deals this month. $276K sold, $346K rented. Property cards, agent tracking, map view, average sale value trending +10% - every number a real estate operator actually needs, on one clean white canvas.


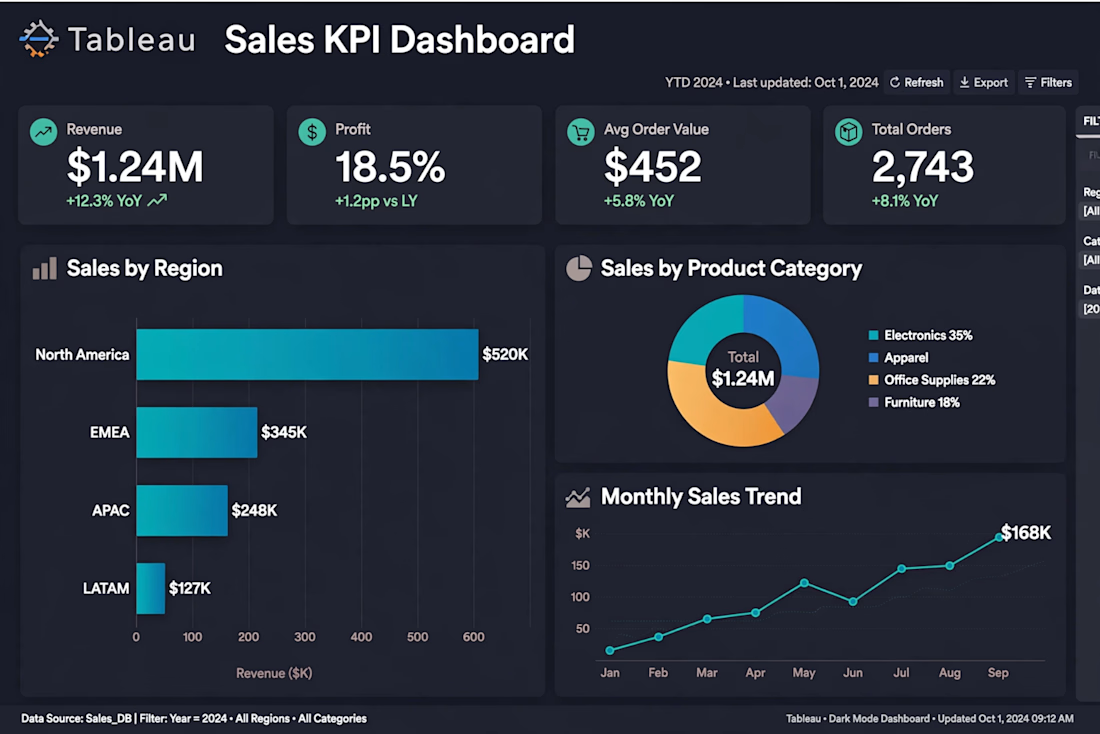
Sales Dashboard - Excel to Tableau in 48 Hours



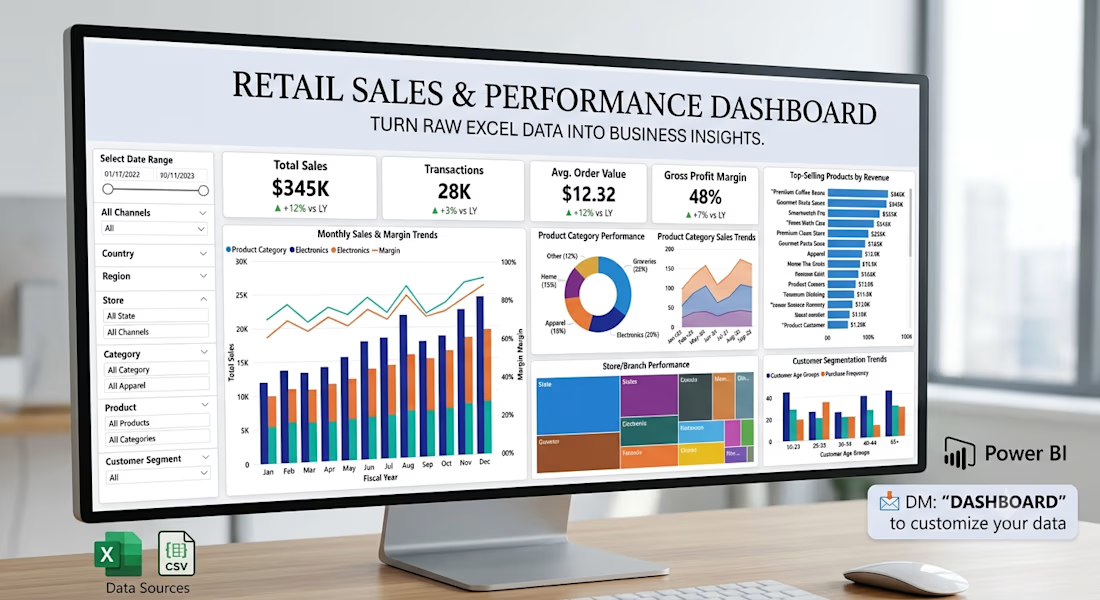
📊 Turn Your Excel Data Into a Clear Business Dashboard
Still managing your business reports in Excel and spending hours trying to understand your numbers?
I help small businesses turn their existing Excel/CSV data into simple, interactive Power BI dashboards.
With a dashboard, you can quickly track:
• 📈 Sales performance
• 🏆 Top-selling products
• 👥 Customer trends
• 🏪 Store/branch performance
• 📦 Product performance
• 🎯 KPIs and monthly targets
I recently built a retail analytics dashboard using Power BI, with data cleaning and transformation using Excel/Power Query.
I'm currently looking to work with small businesses, retailers, and growing teams that want their data to be easier to understand and use.
💬 If you already maintain your business data in Excel, feel free to message me. I'd be happy to show you what a dashboard could look like for your business.