The network for creativity
Join 1.25M professional creatives like you
Connect with clients, get discovered, and run your business 100% commission-free
Creatives on Contra have earned over $150M and we are just getting started
Back to feedPost

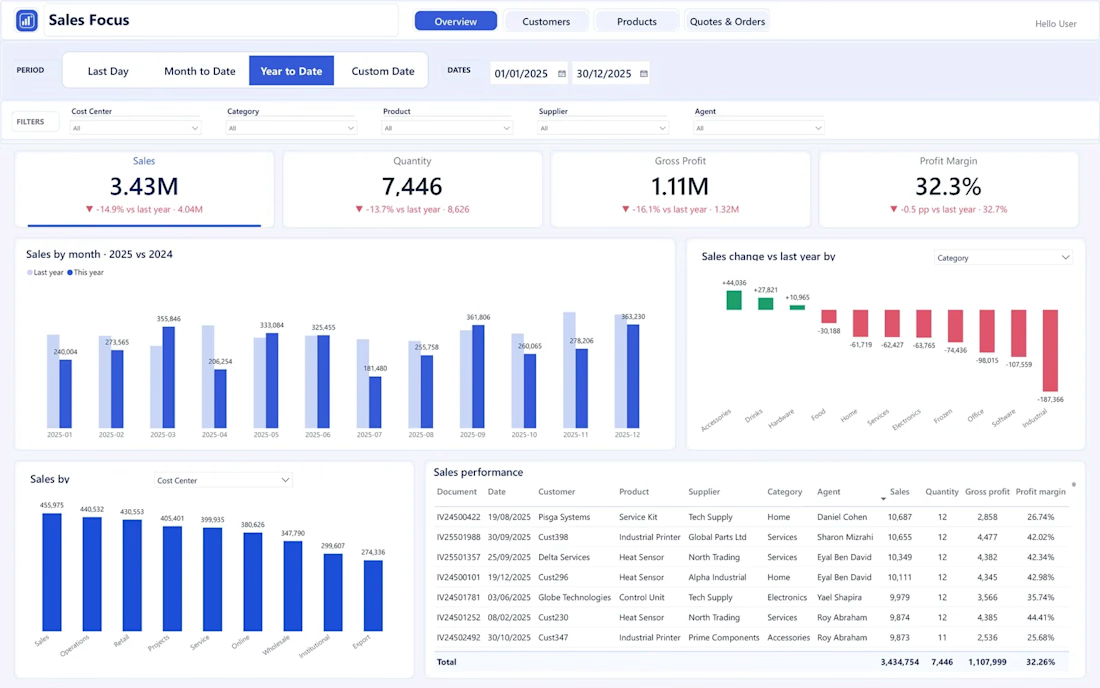
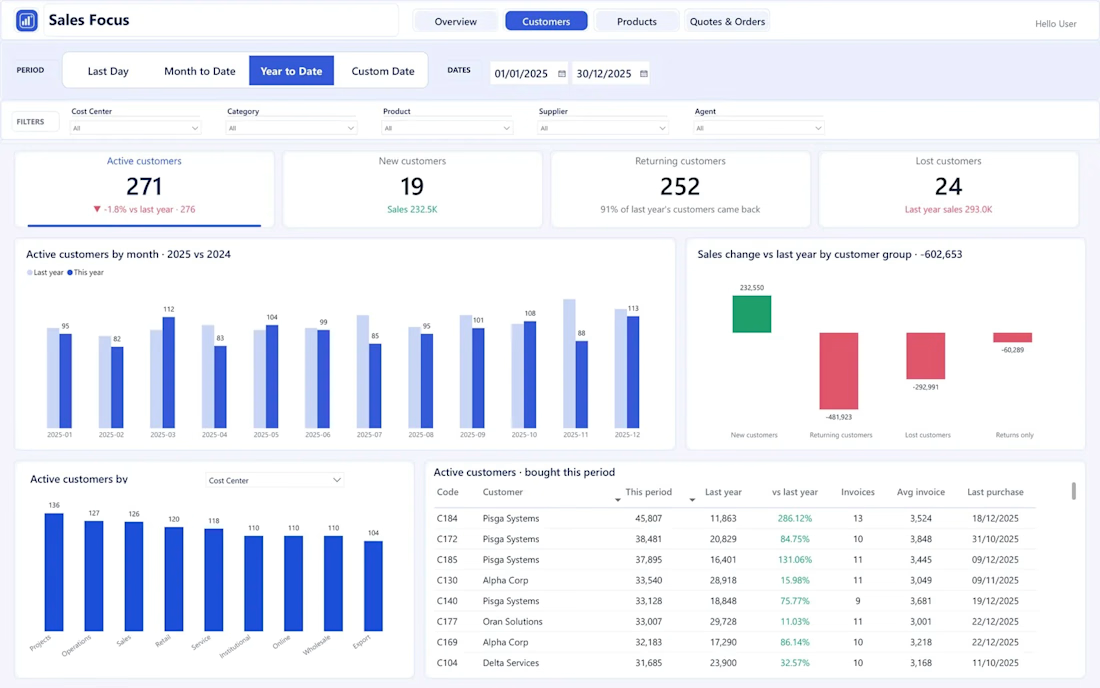
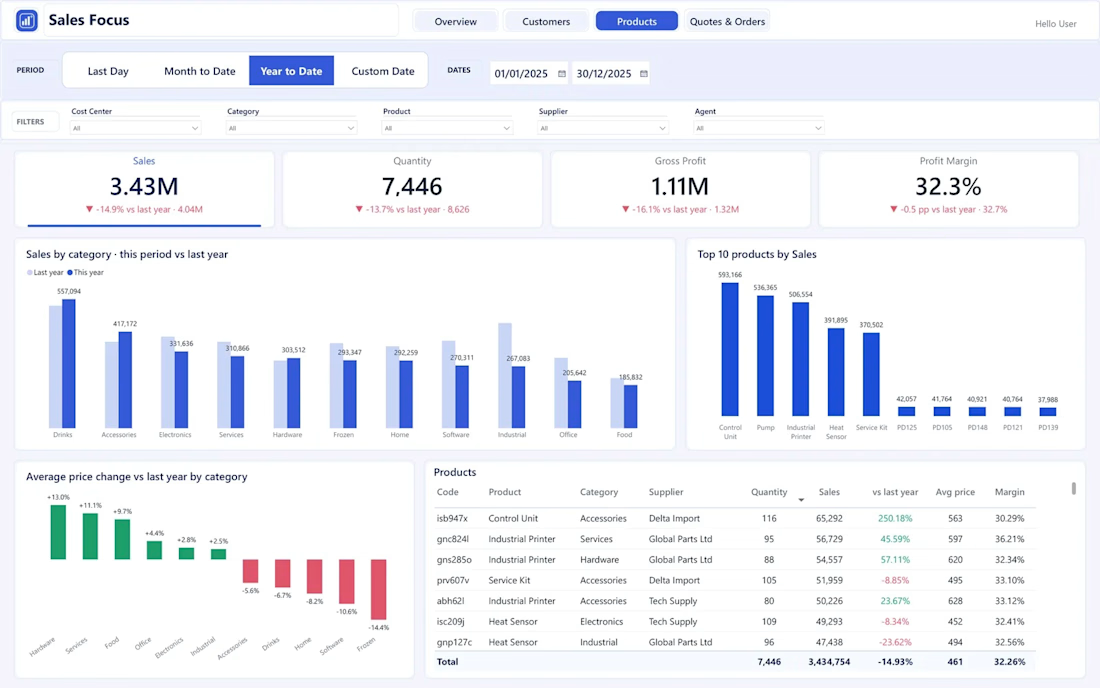
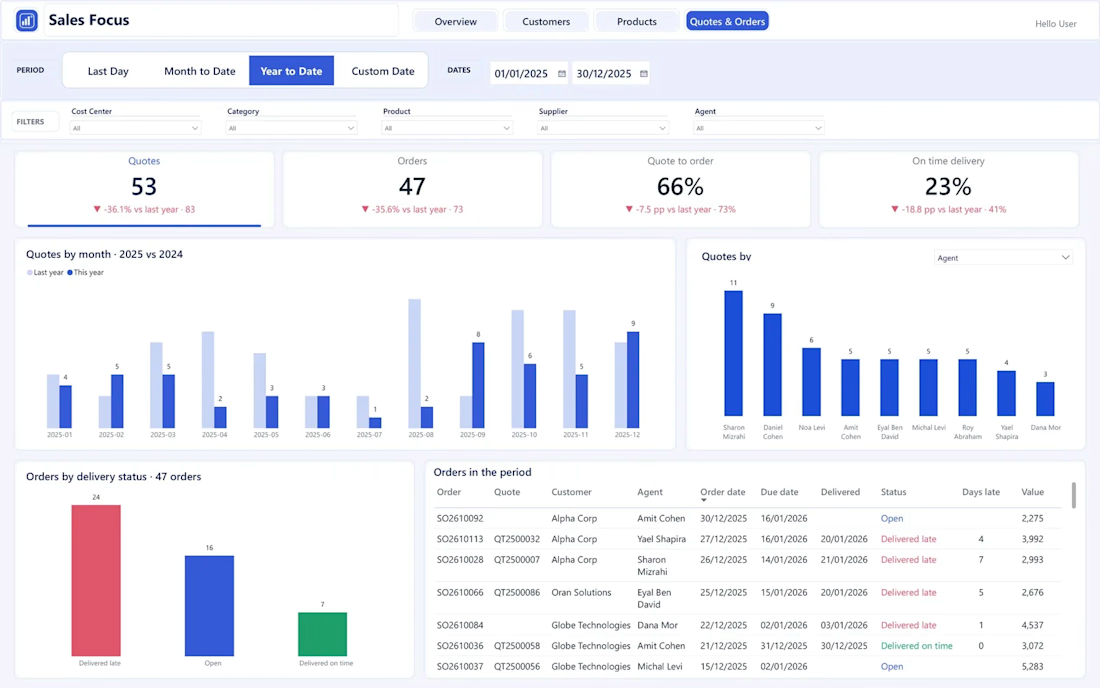
Sales Focus | Interactive Power BI Sales Analytics. One click period buttons (Last Day, Month to Date, Year to Date, Custom Date) and clickable KPI cards that switch every chart to the selected metric. Four screens: Overview, Customers, Products, and Quotes & Orders, all compared to last year.


The network for creativity
Join 1.25M professional creatives like you
Connect with clients, get discovered, and run your business 100% commission-free
Creatives on Contra have earned over $150M and we are just getting started



Related posts

AI Analytics Dashboard
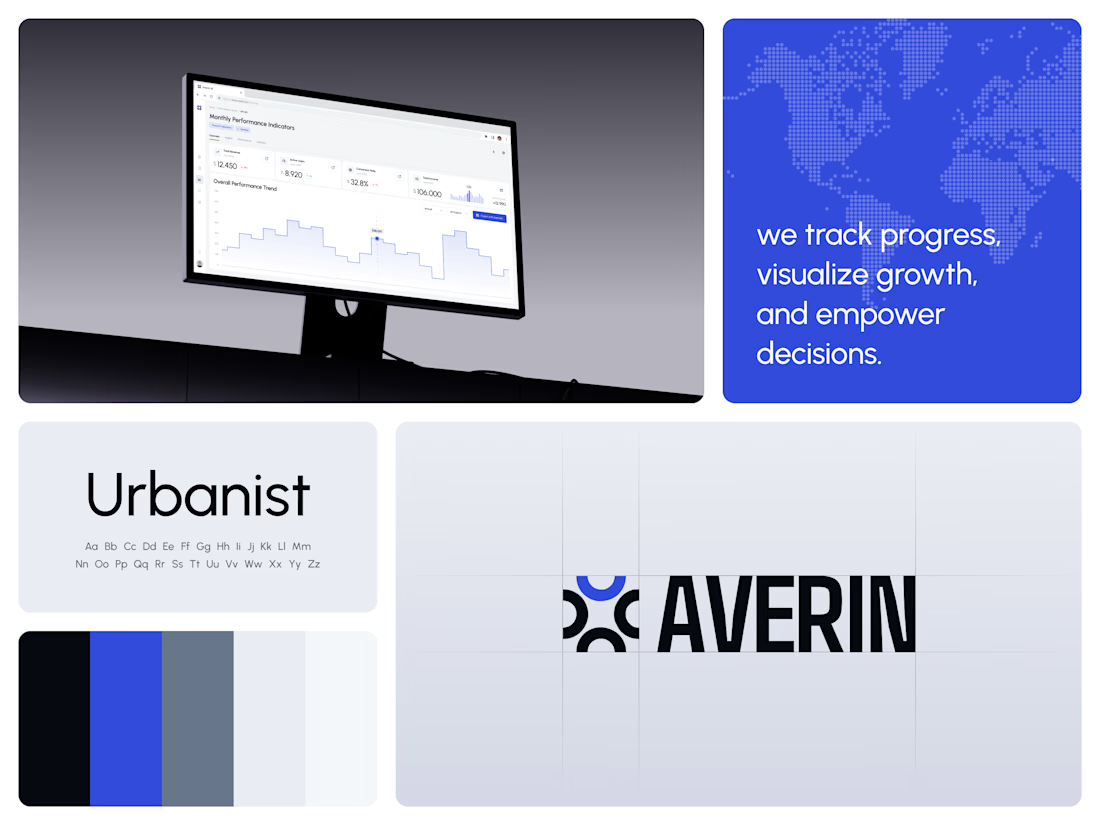
One blue runs from the logo to the chart line.
Revenue, active users, conversion rate and income sit in a row of cards above the trend chart. The cards answer where the numbers stand. The stepped line answers how they got there, holding each period's value until the next, with a tooltip on a dashed guide line for the exact figure.
The identity pairs a four-arc mark with a condensed wordmark, drawn to the same top and bottom lines on the construction grid. The top arc's blue comes back in the slogan tile, the chart line and the main button, so the brand and the product share one accent.
Designed by the Hue & Machine team.
#DashboardDesign #DataVisualization #SaaS #Analytics #AI #WebApp #BrandIdentity #UIDesign #ProductDesign #FigmaDesign



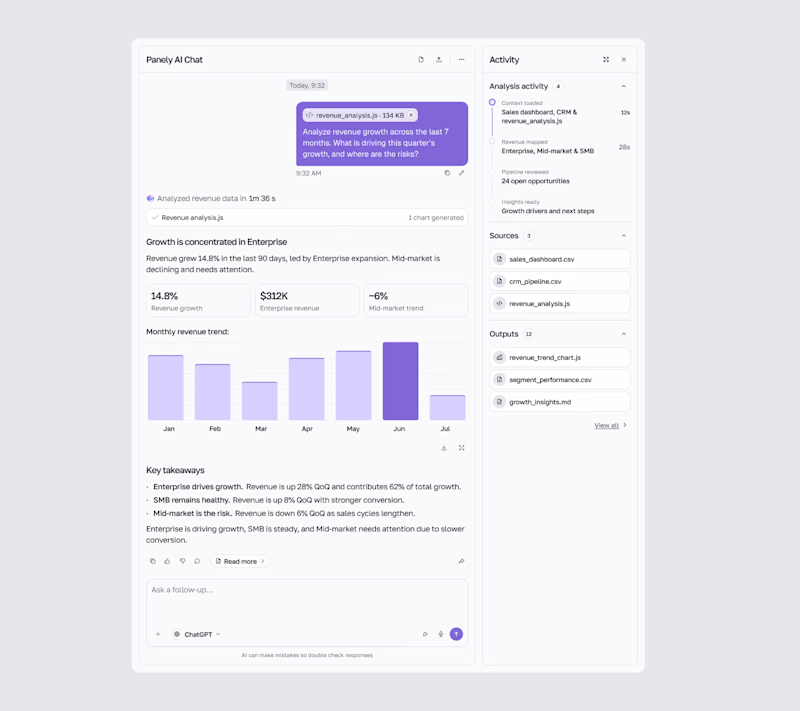
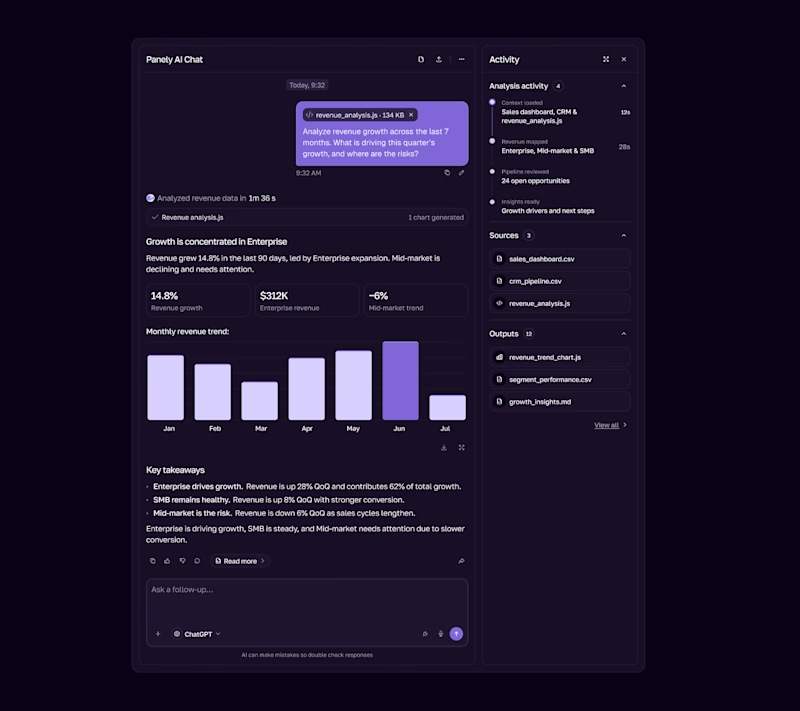

I'd pick Light for an analysis tool, the charts and sources read better on a pale surface and the violet bars still pop. Dark works as the night option. Is the sources panel on the right open by default?


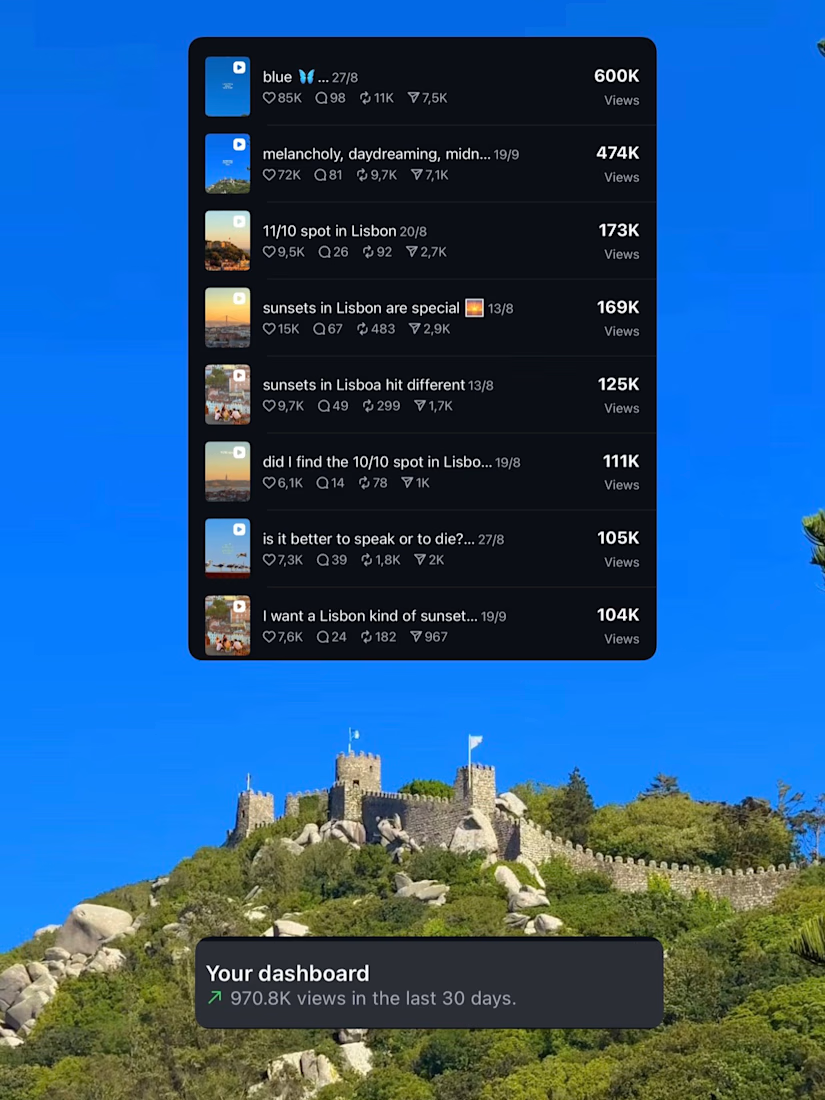
3 months of just posting what I like and apparently the algorithm likes it too


Nice!