
Arjun Thakur
Data Analyst skilled in SQL, Python, Power BI, and Tableau.
New to Contra
Arjun is ready for their next project!


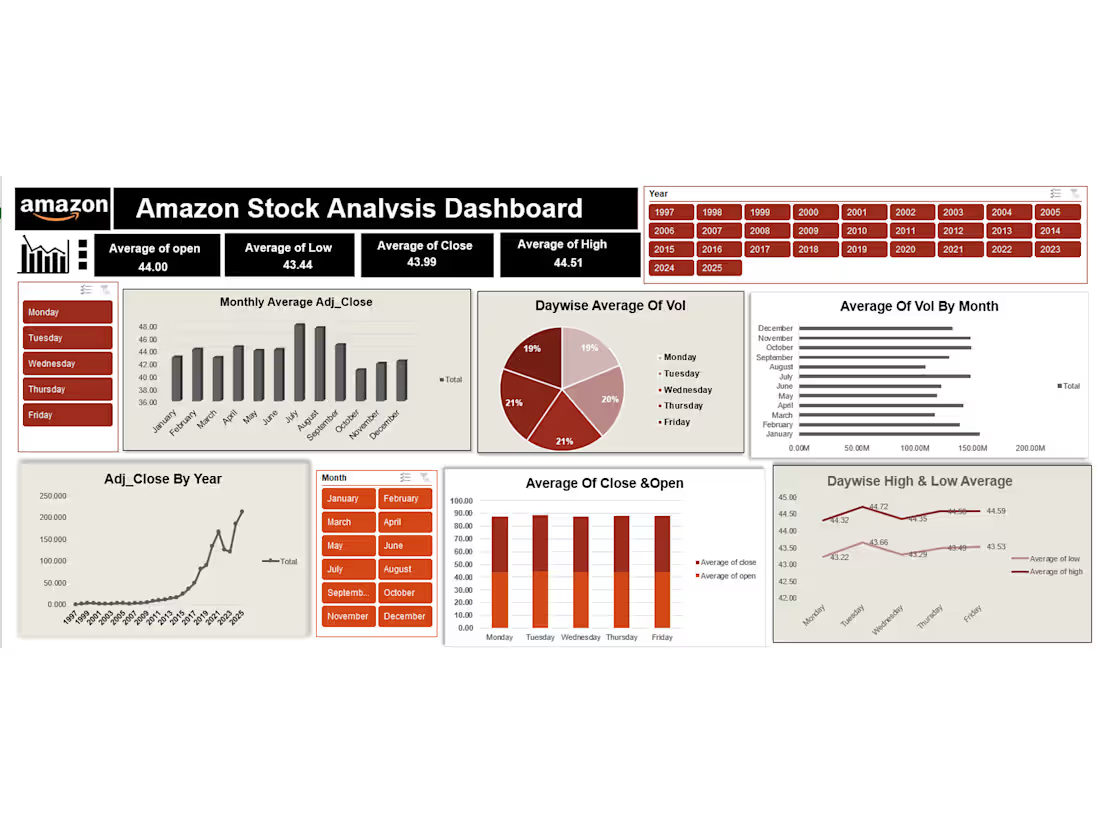
Amazon Stock Analysis Dashboard — Contra Description
Created an interactive Excel dashboard to analyze Amazon stock performance across different years, months, and weekdays. The dashboard visualizes opening, closing, high, low, and adjusted closing prices, along with trading volume trends.
It includes interactive Year, Month, and Weekday filters, allowing users to explore stock trends and compare market performance across different time periods.
Tools: Microsoft Excel, Pivot Tables, Pivot Charts, Slicers, Data Analysis, Data Visualization
0
22
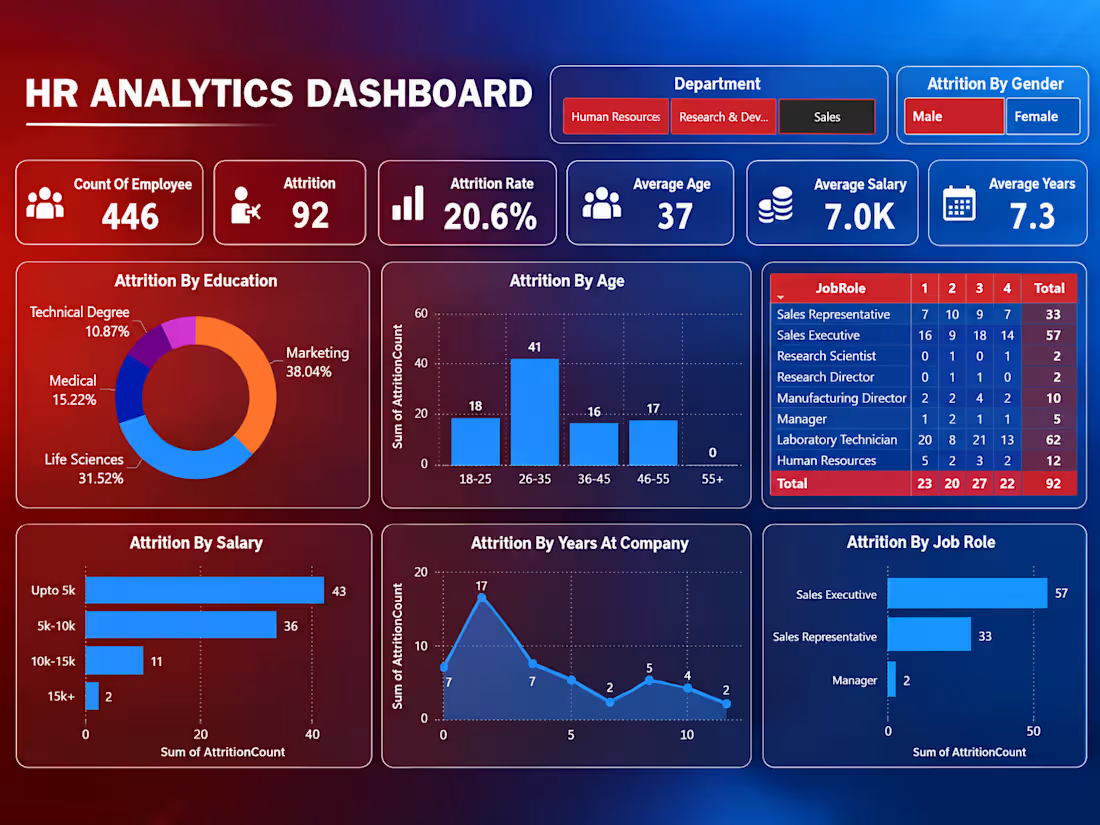
HR Analytics Dashboard — Project Description
An interactive Power BI HR Analytics Dashboard designed to analyze employee attrition and workforce trends. The dashboard provides insights into employee count, attrition rate, average age, salary, years at the company, education, job roles, salary ranges, and gender-based attrition.
I used data cleaning, Power Query, DAX, KPI cards, charts, tables, and interactive filters to identify employee attrition patterns and understand which departments, job roles, salary ranges, and age groups have higher attrition.
Tools: Power BI, Power Query, DAX, Data Visualization
0
43
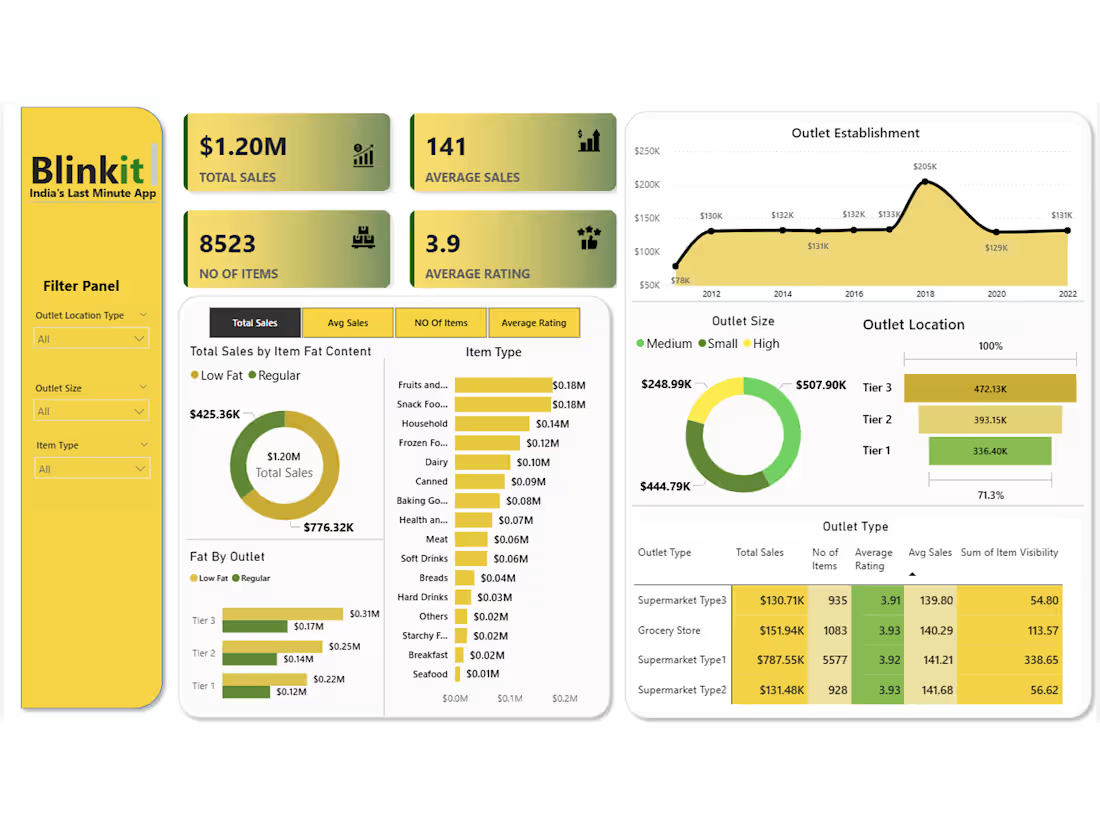
Retail Sales & Outlet Performance Dashboard — Project Description
An interactive Power BI dashboard developed to analyze retail sales and outlet performance. The dashboard provides insights into total sales, average sales, number of items, customer ratings, item categories, outlet sizes, locations, and outlet types.
I used data cleaning, transformation, DAX, KPI cards, donut charts, bar charts, line charts, and interactive filters to present key business insights and compare the performance of different products and outlets.
Tools: Power BI, Power Query, DAX, Data Visualization
0
63
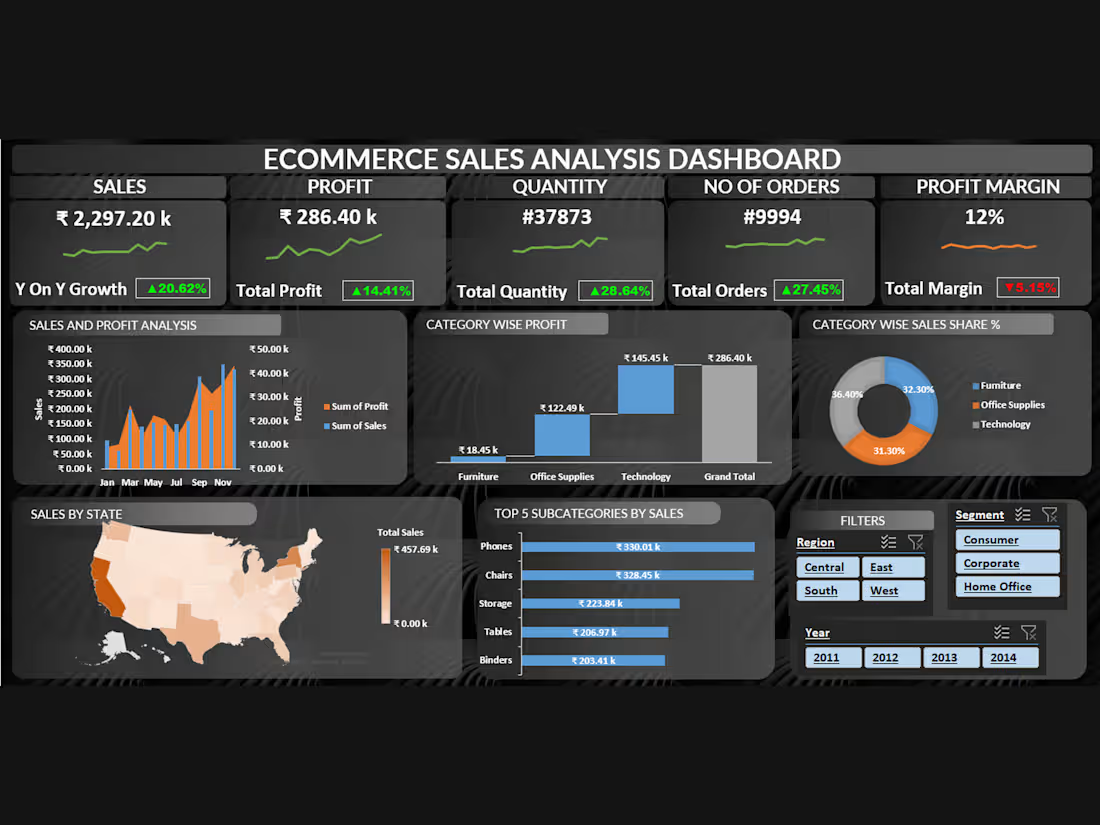
E-Commerce Sales Analysis Dashboard — Project Description
An interactive Power BI dashboard designed to analyze e-commerce sales performance and uncover business insights. The dashboard tracks key metrics such as sales, profit, quantity, orders, and profit margin, while providing detailed analysis by category, subcategory, region, state, segment, and year.
I used data cleaning, transformation, DAX measures, KPI cards, charts, maps, and interactive filters to create a user-friendly dashboard that helps identify sales trends, profitable categories, top-performing products, and regional performance.
Tools: Power BI, Power Query, DAX, Data Visualization
0
86