
Aniruddha Deo
Power BI Developer & Data Analytics Specialist.
New to Contra
Aniruddha is ready for their next project!

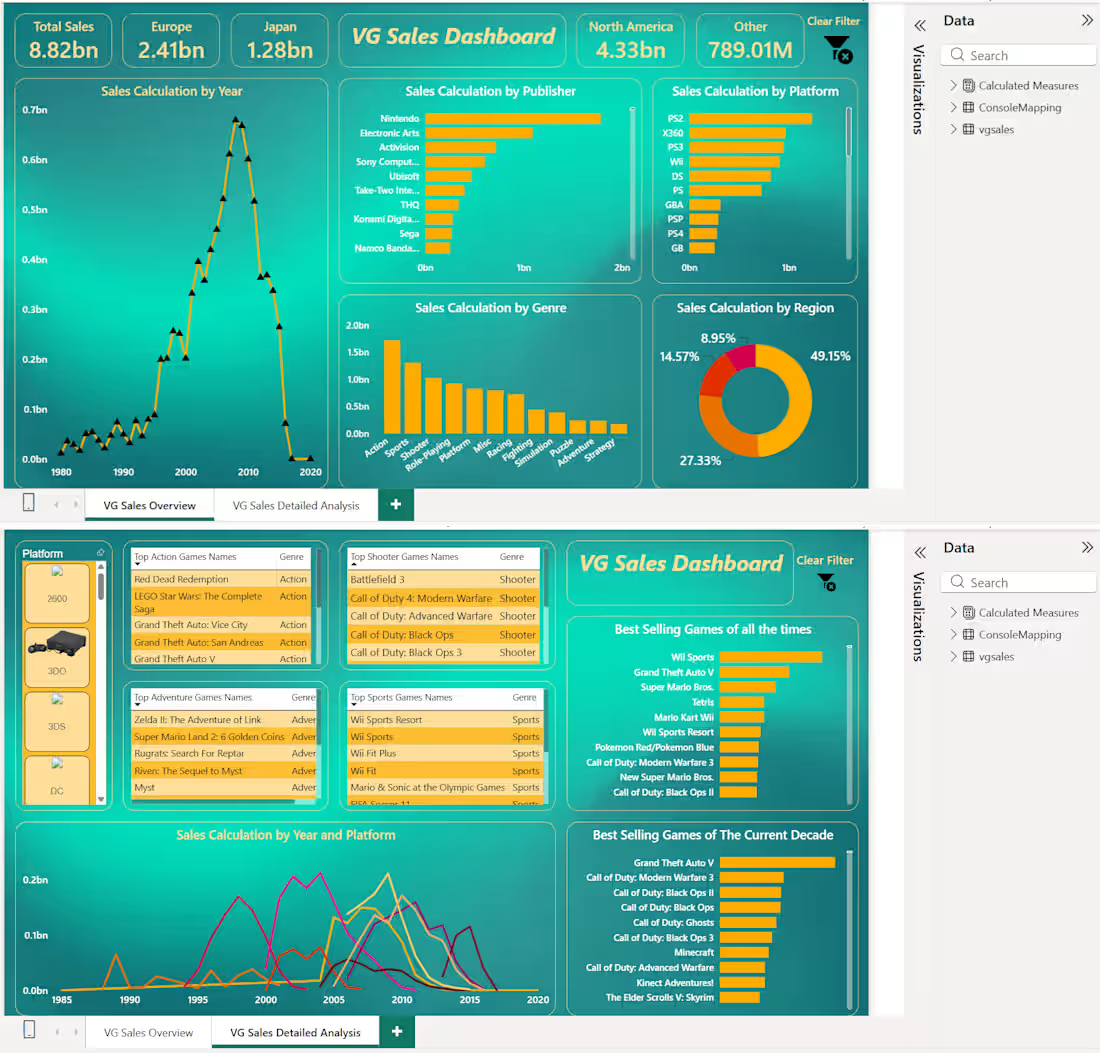
Project Overview:
Designed and developed an interactive Global Video Game Commercial Sales & Market Analytics Dashboard in Power BI, analyzing $8.82 Billion in historical sales data across 40+ years, 30+ gaming platforms, 12 genres, and top global publishers.
Key Highlights & Metrics:
• Global & Regional Revenue Breakdown: Visualized $8.82B total sales across North America ($4.33B / 49%), Europe ($2.41B / 27%), Japan ($1.28B / 15%), and Rest of World ($789M).
• Historical Trends & Peak Market Analysis: Mapped annual sales cycles from 1980 to 2020, identifying the market peak (2008–2010) and platform lifecycle shifts over time.
• Top Publishers & Platforms: Ranked industry leaders—with Nintendo, EA, and Activision leading publisher revenue, and PS2, Xbox 360, and PS3 dominating hardware platform sales.
• Genre & Title Leaderboards: Classified top-grossing categories (Action at $1.7B+ and Sports at $1.3B+) alongside all-time best-selling titles (Wii Sports, GTA V, Super Mario Bros).
• Custom Interactive UX: Built dynamic visual platform slicers, multi-genre drill-down tables, and a one-click "Clear Filter" reset navigation.
0
9
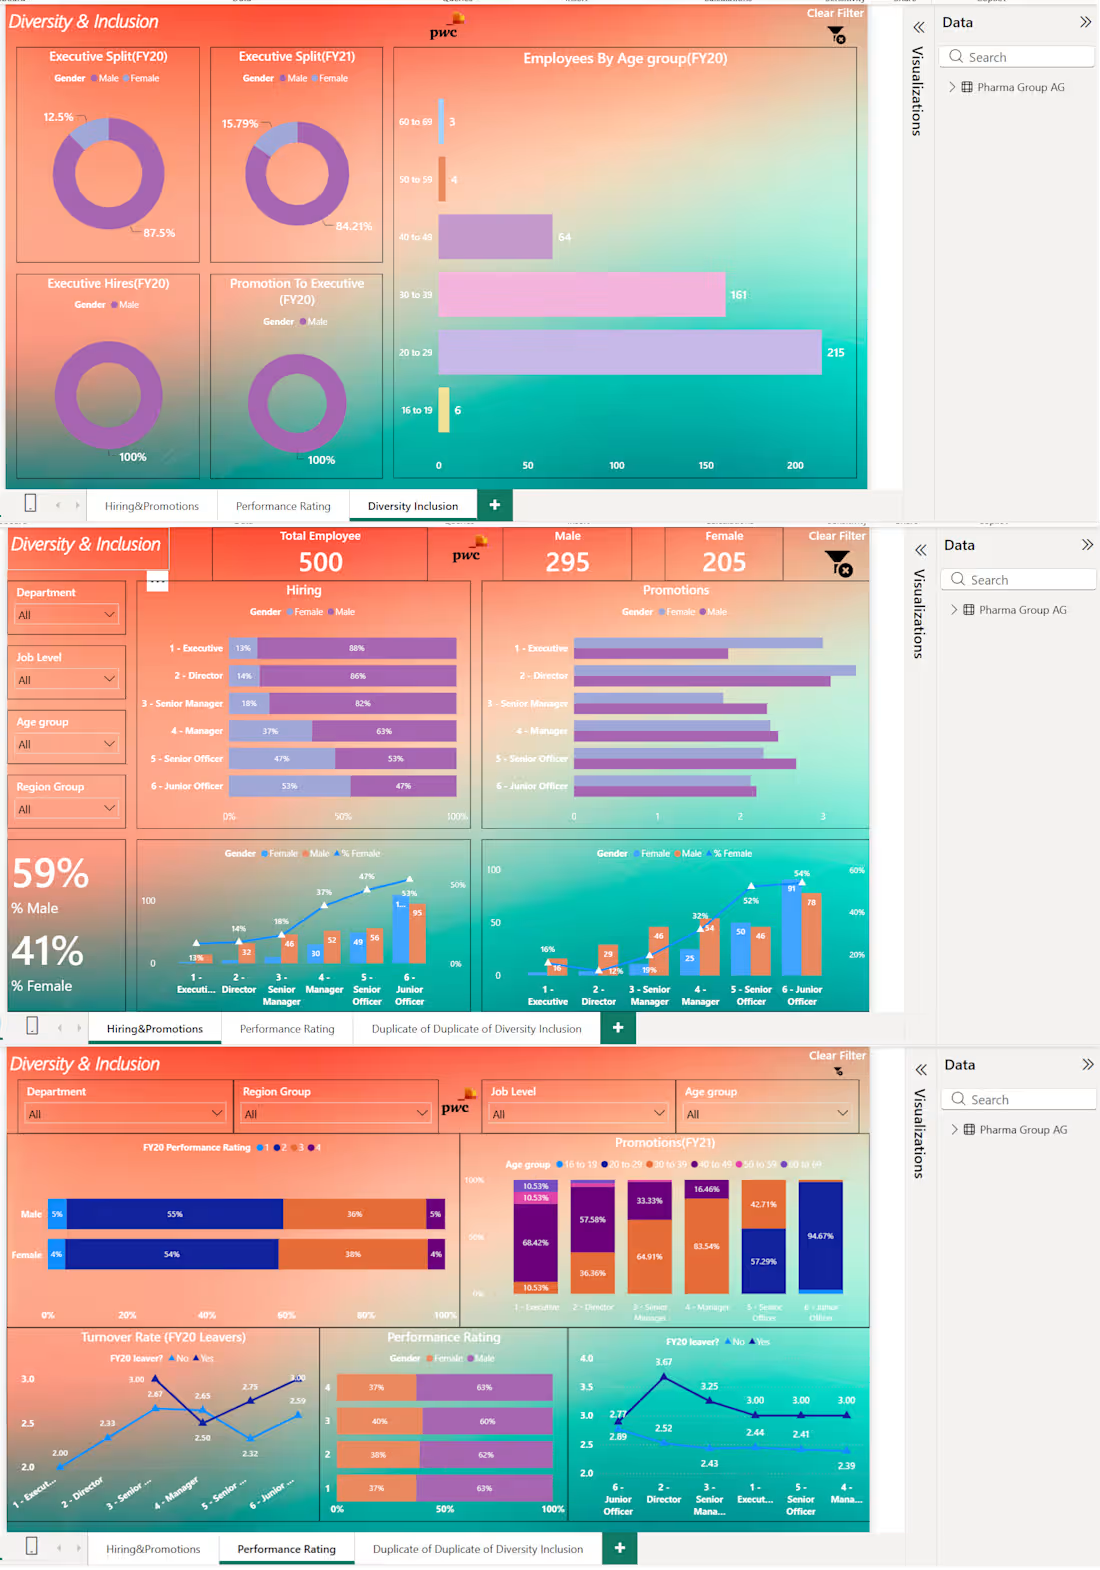
Project Overview:
Designed and delivered a multi-page Diversity & Inclusion (D&I) and HR Analytics Dashboard in Power BI for an enterprise organization (Pharma Group AG), providing C-suite and HR leadership with actionable visibility into workforce demographics, career progression equity, and turnover trends across 500+ employees.
Key Insights & Features Delivered:
• Executive Gender Split & Glass Ceiling Analysis: Analyzed gender representation across leadership tiers, tracking changes in executive gender split (87.5% to 84.2% Male) and identifying gaps in executive hiring and promotions.
• Hiring & Promotion Funnel: Visualized representation across all 6 organizational job levels (from Junior Officer to Director/Executive), highlighting female representation drop-off from 53% at entry levels to 12.5% at executive levels.
• Age Demographics & Generational Split: Mapped headcount across 6 age brackets (20-29 and 30-39 representing 75%+ of the total workforce) to assist in workforce succession planning.
• Performance Rating & Turnover Analysis: Correlated employee turnover rates (FY20 leavers vs. stayers) against performance appraisal scores (Bands 1 to 4) and job seniority levels to identify retention risks.
• Dynamic Filtering: Implemented interactive slicers for Department, Region, Job Level, and Age Group, paired with custom "Clear Filter" reset navigation.
Technical Implementation:
• Platform: Microsoft Power BI Desktop & Service
• ETL & Data Modeling: Power Query (M) for data cleaning; Star-Schema data model linking employee records with demographic dimensions.
• Advanced DAX: Created measures for % Female Representation, YoY Promotion Velocity, Turnover Rate %, and Weighted Performance Averages.
0
15
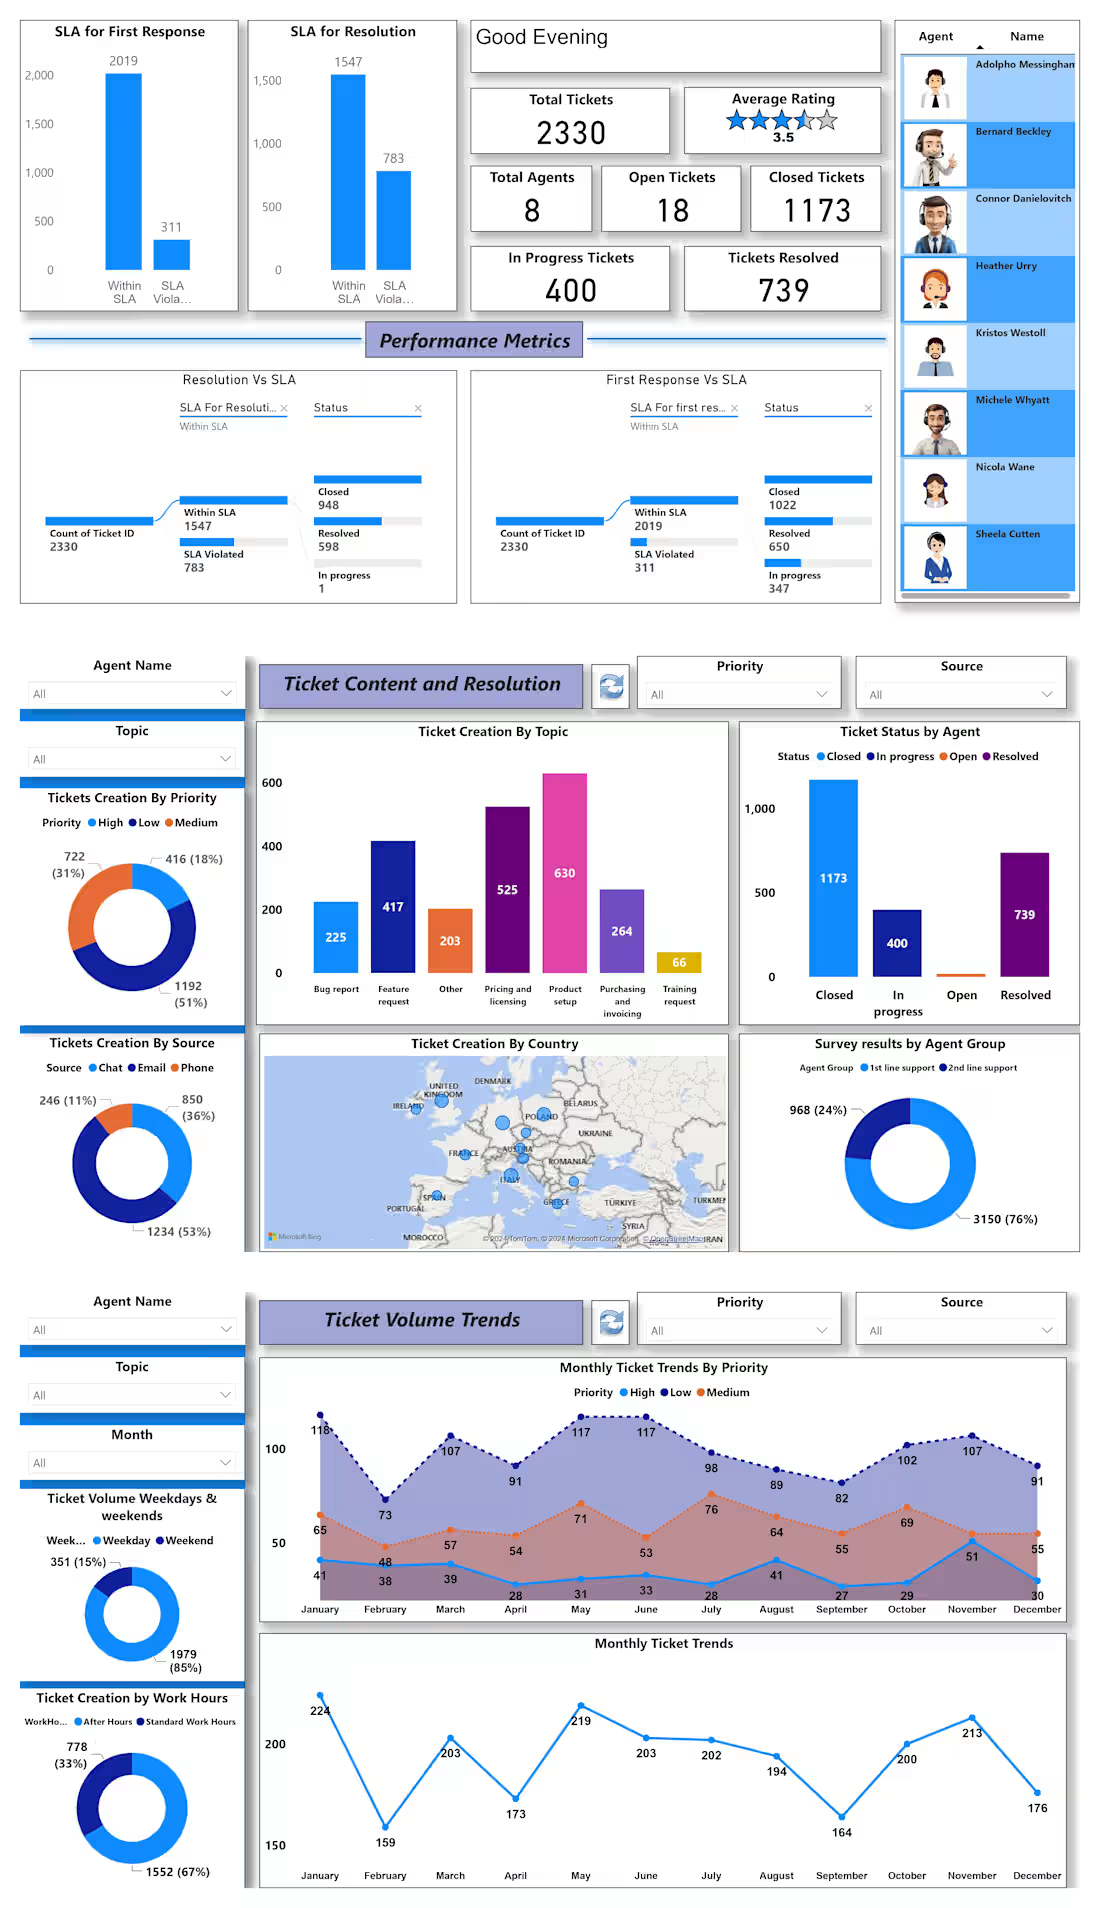
Are you struggling to track support tickets, agent productivity, and SLA breaches across your helpdesk or call center?
I will build a custom, executive-ready Power BI Technical Support & SLA Dashboard (similar to the Onyx Analytics Suite) that transforms your raw support logs into clear, actionable insights.
What this gig includes:
✔ SLA Tracking: Real-time monitoring of first response & resolution SLA compliance vs. violations
✔ Agent Performance: Individual scorecards measuring tickets resolved, handle time, and CSAT customer ratings
✔ Volume & Peak Analysis: Hourly peak heatmaps (identifying surge hours) and weekday vs. weekend distribution
✔ Root Cause & Topic Breakdown: Ticket categorization by bug reports, product setup, invoicing, and feature requests
✔ Multi-Channel Visibility: Unified tracking across chat, email, and phone support channels
✔ Geographic Mapping: Country and regional ticket density analysis
Why work with me?
• 10+ years of enterprise data analytics and BI development experience
• Clean Star-Schema data modeling for lightning-fast report performance
• Optimized DAX measures (Time Intelligence, SLA %, Averages, and Dynamic Ranking)
• 100% responsive, professional design tailored to your company branding
Deliverables: Complete .PBIX source file, clean Power Query transformations, and full deployment support.
0
18
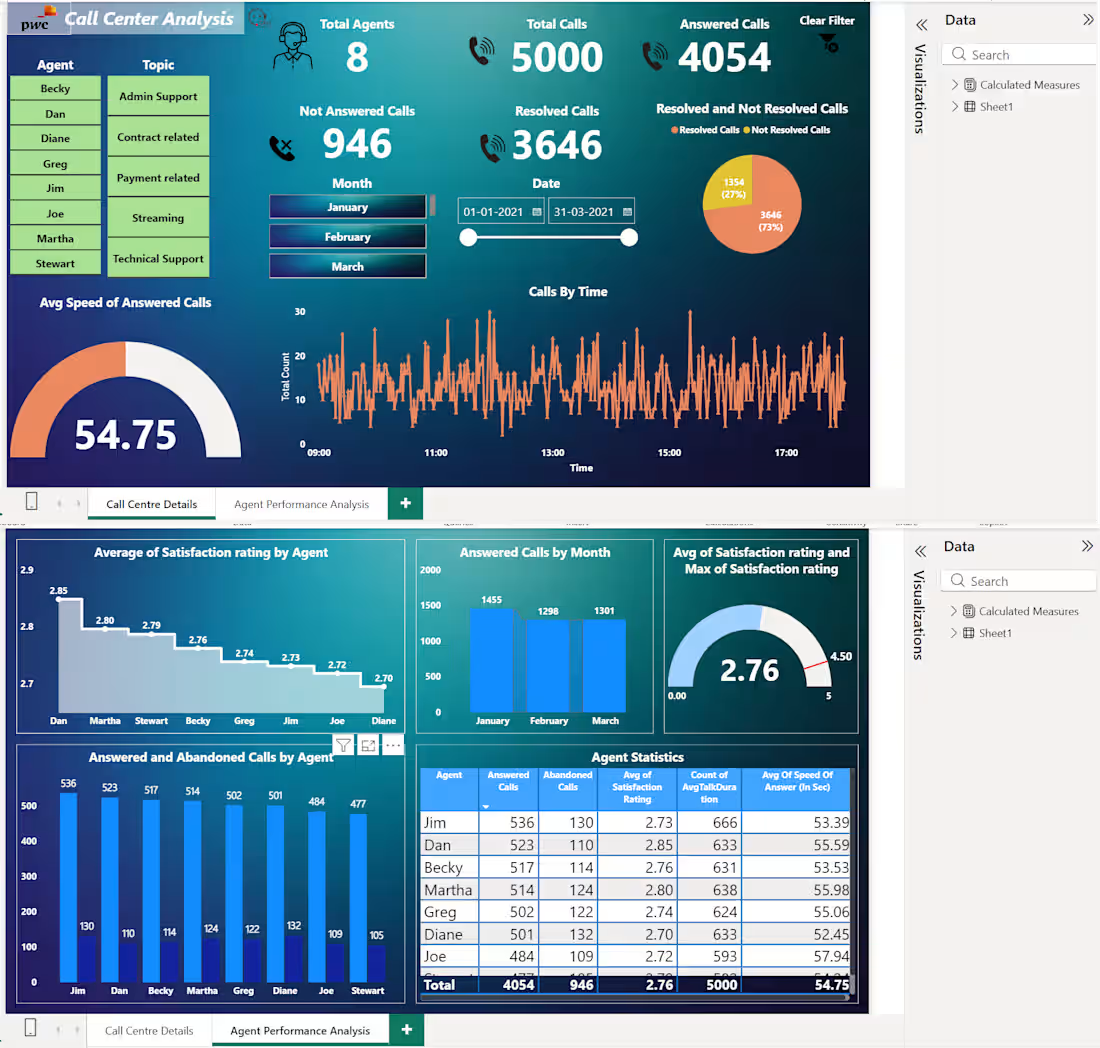
Do you need full visibility into your support operations, agent productivity, and SLA compliance?
I design executive-ready Power BI dashboards that turn raw ticketing and call logs into actionable insights.
What this dashboard delivers:
✔ SLA Tracking: First-response and resolution SLA compliance vs. violations
✔ Call Center KPIs: Total calls, answered vs. abandoned rate, average speed of answer (ASA)
✔ Agent Scorecards: Individual resolution rates, average handle time, and CSAT customer satisfaction scores
✔ Peak Volume Trends: Hourly/monthly ticket creation patterns to optimize staff scheduling
✔ Root Cause Breakdown: Categorization by topic, product, priority, and region
Deliverables: Complete .PBIX file, optimized data model, DAX measures, and mobile layout.
0
22