
Aditya Sharma
Turning complex data into decisions you can act on.
New to Contra
Aditya is building their profile!
Sales Performance Dashboard
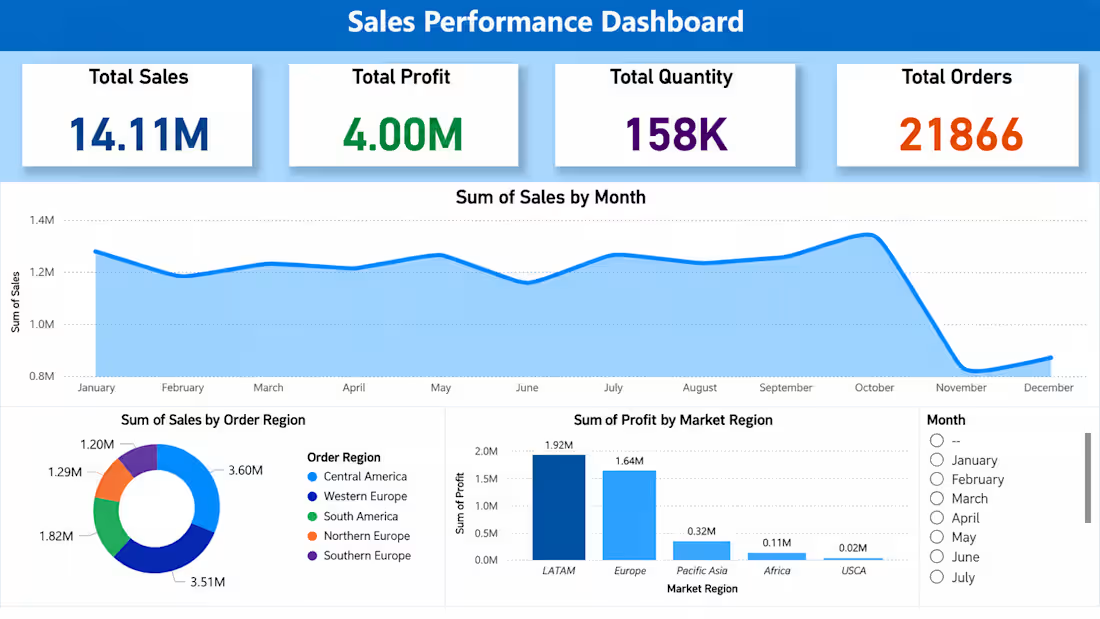
Built an interactive sales dashboard in Power BI to analyze sales, profit, quantity, and orders across different months, regions, and markets.
I worked with the data to create key performance indicators and visualizations that make it easier to understand sales trends and regional performance.
The dashboard includes:
Total Sales, Profit, Quantity, and Orders
Monthly sales trends
Sales breakdown by order region
Profit comparison across market regions
Interactive month filtering
0
9
Spotify Data Analysis
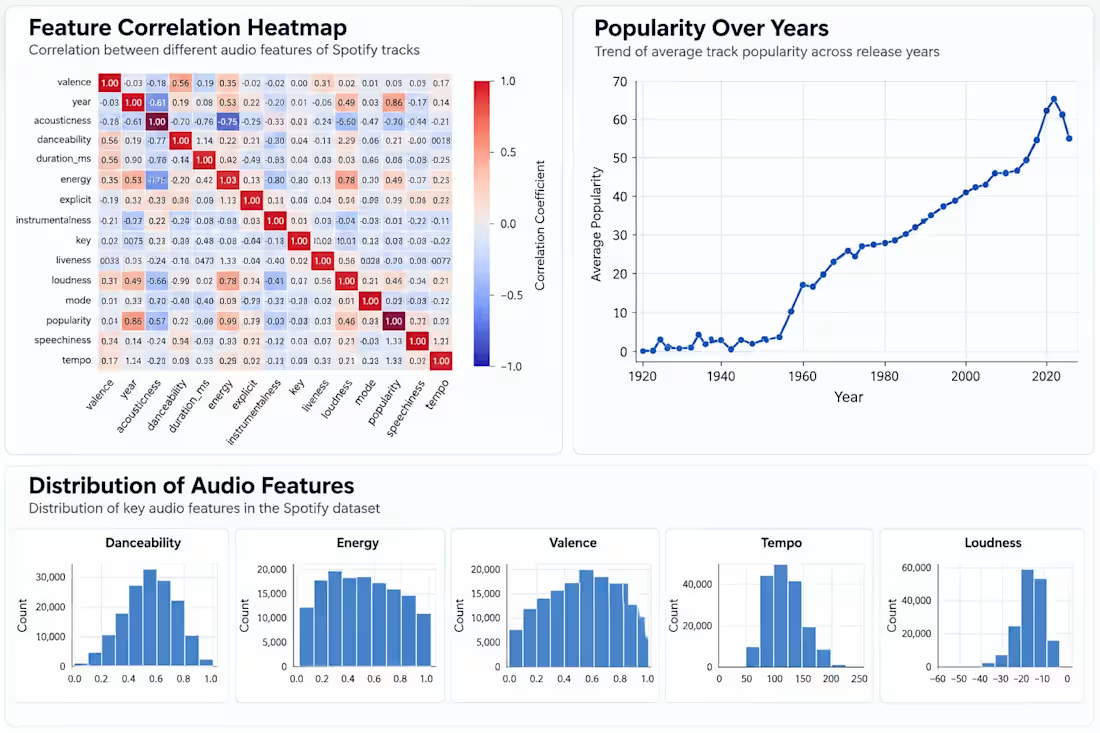
Analyzed a Spotify tracks dataset using Python to understand patterns in music features and popularity.
I cleaned and explored the data, looked at relationships between different audio features, and created visualizations to make the findings easier to understand.
What I explored:
Correlation between audio features
Popularity trends over the years
Distribution of danceability, energy, valence, tempo, and loudness
Relationships between different characteristics of tracks
0
11
:Netflix Content Analysis
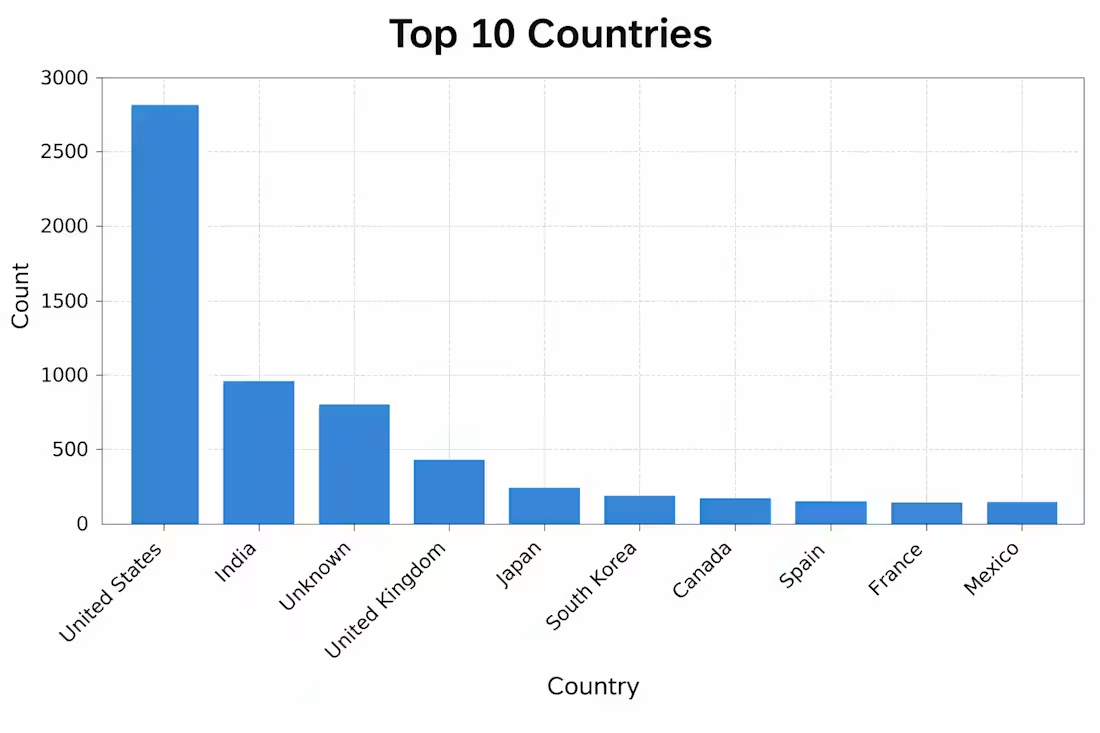
Analyzed the Netflix titles dataset using Python to explore content trends and patterns. I cleaned and explored the data, then created visualizations to look at the balance between Movies and TV Shows, top countries, content release trends, and popular genres.
Tools: Python, Pandas, Matplotlib, Seaborn
Key areas explored:
Movies vs. TV Shows
Top countries by number of titles
Content release trends over the years
Most common genres
The goal was to turn a raw dataset into simple visual insights that are easy to understand.
0
29