The network for creativity
Join 1.25M professional creatives like you
Connect with clients, get discovered, and run your business 100% commission-free
Creatives on Contra have earned over $150M and we are just getting started
Back to feedPost

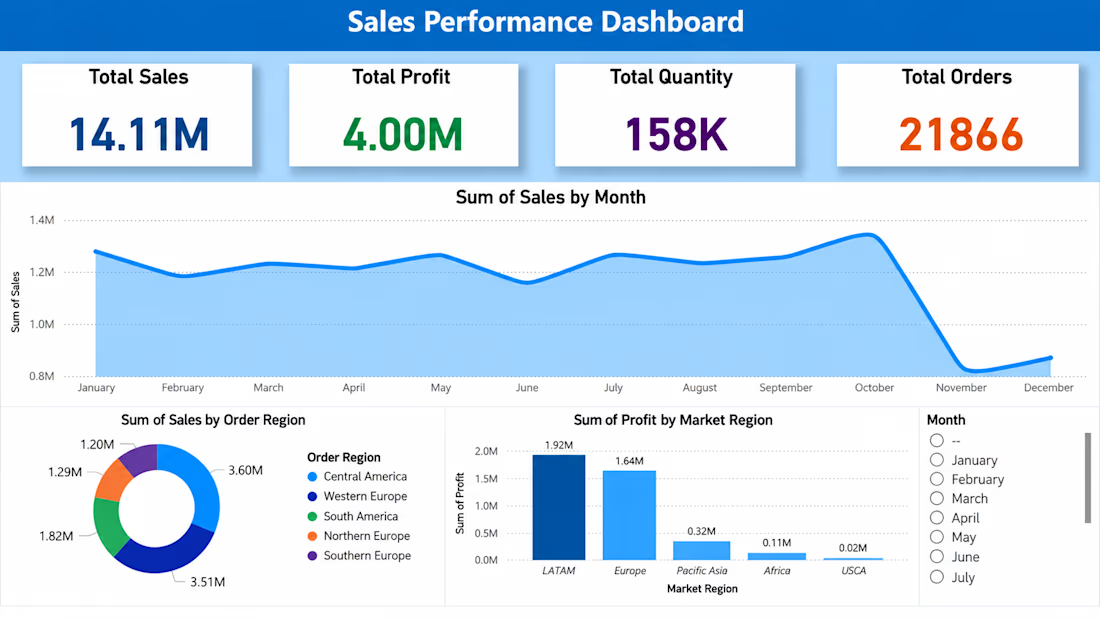
Sales Performance Dashboard
Built an interactive sales dashboard in Power BI to analyze sales, profit, quantity, and orders across different months, regions, and markets.
I worked with the data to create key performance indicators and visualizations that make it easier to understand sales trends and regional performance.
The dashboard includes:
Total Sales, Profit, Quantity, and Orders
Monthly sales trends
Sales breakdown by order region
Profit comparison across market regions
Interactive month filtering


The network for creativity
Join 1.25M professional creatives like you
Connect with clients, get discovered, and run your business 100% commission-free
Creatives on Contra have earned over $150M and we are just getting started

Challenges
View all


Related posts

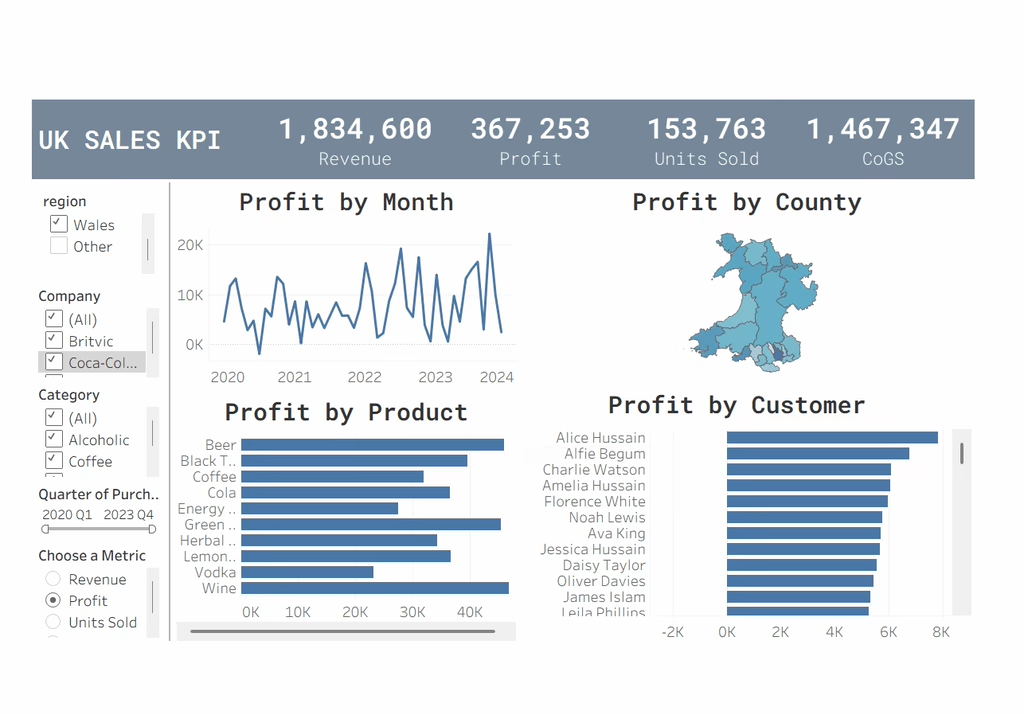
UK Sales KPI Dashboard: An interactive Tableau dashboard tracking Revenue, Profit, Units Sold, and CoGS with region, company, category, and quarter filters.


Retail Media ROAS Command Center – Power BI Dashboard
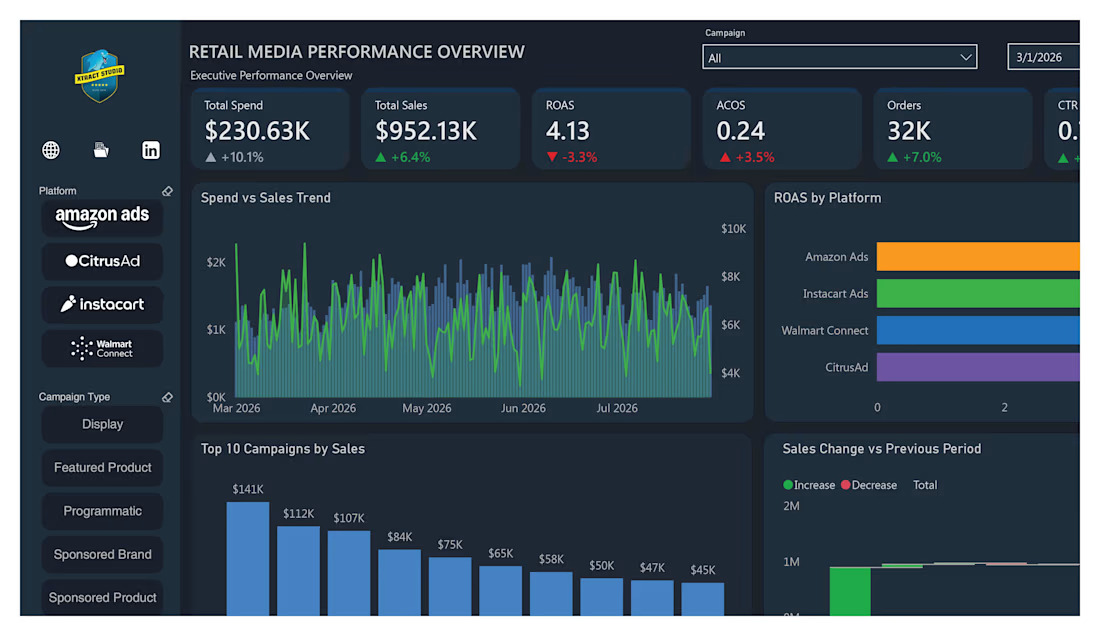
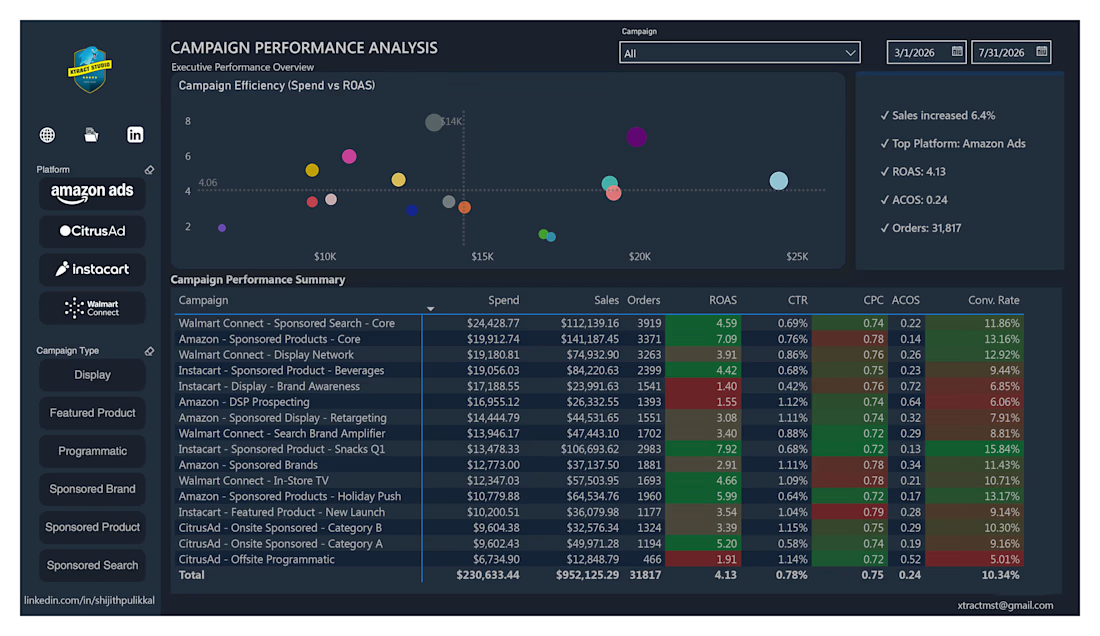
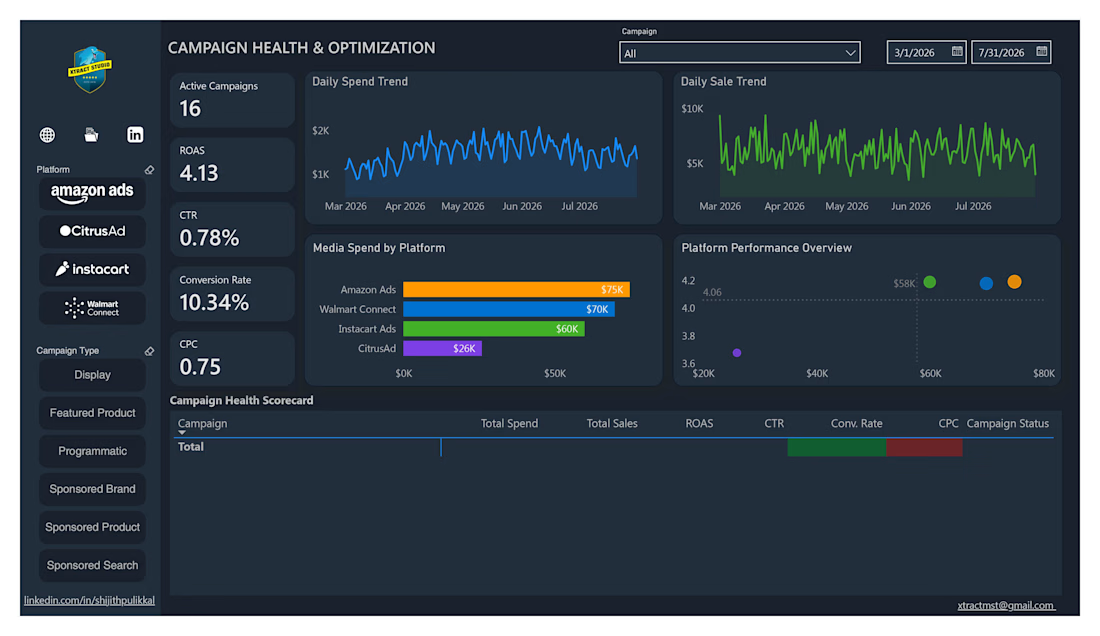
Built a multi-page Power BI dashboard consolidating retail media ad performance (Instacart Ads, Walmart Connect, CitrusAd) into one executive view. Features a true weighted ROAS measure (SUM(Sales)/SUM(Spend), not an averaged ratio — a common calc error), budget pacing alerts, a revenue bridge waterfall breaking down period-over-period change by platform, campaign drill-through with conditional formatting, and anomaly detection on daily spend. Delivered as a customizable, client-ready template.
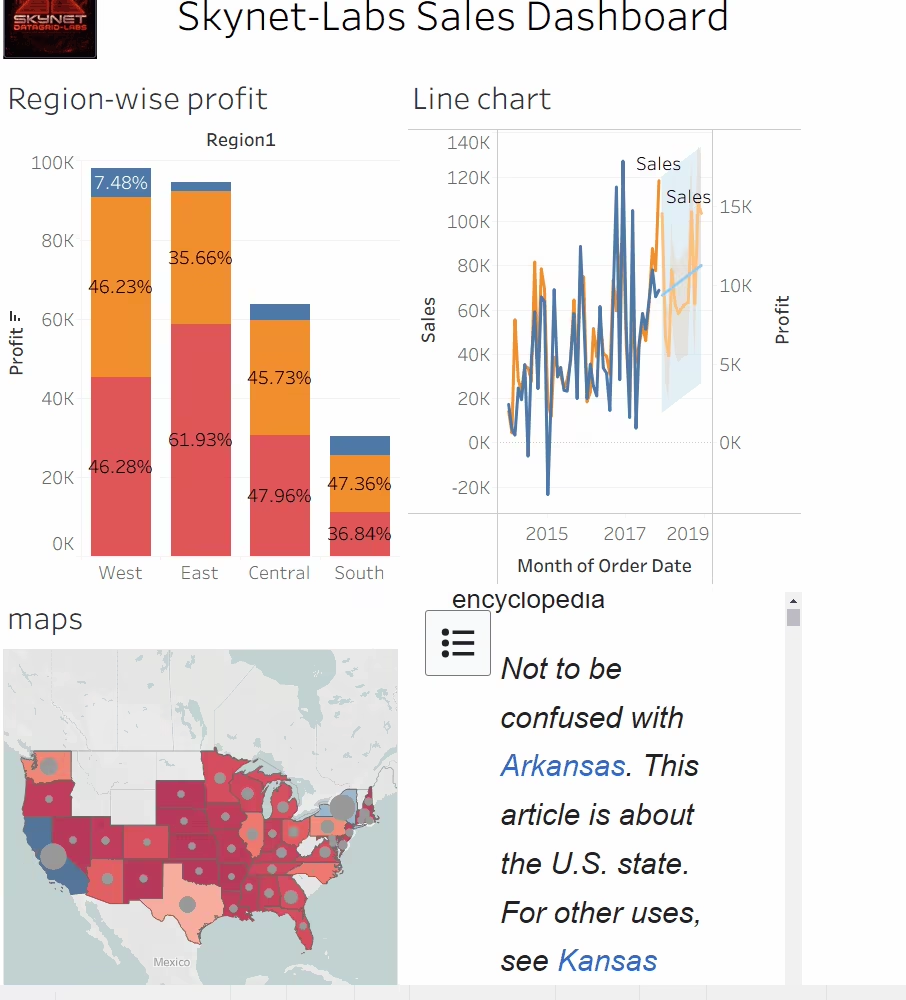
Multi-sheet Tableau workbook demonstrating advanced analytics features including LOD expressions, sets, parameters, and map-based geographic analysis. The dashboard combines region-wise profit distribution via stacked bar charts, dual-axis sales and profit trend lines across 2017–2018, and a choropleth map for territory-level performance visualization. Highlights cross-functional Tableau capability beyond standard charting.