
Abu Aasif Ansari
I build AI-powered data apps and dashboards
Ready for work
Abu Aasif is ready for their next project!
Project Overview
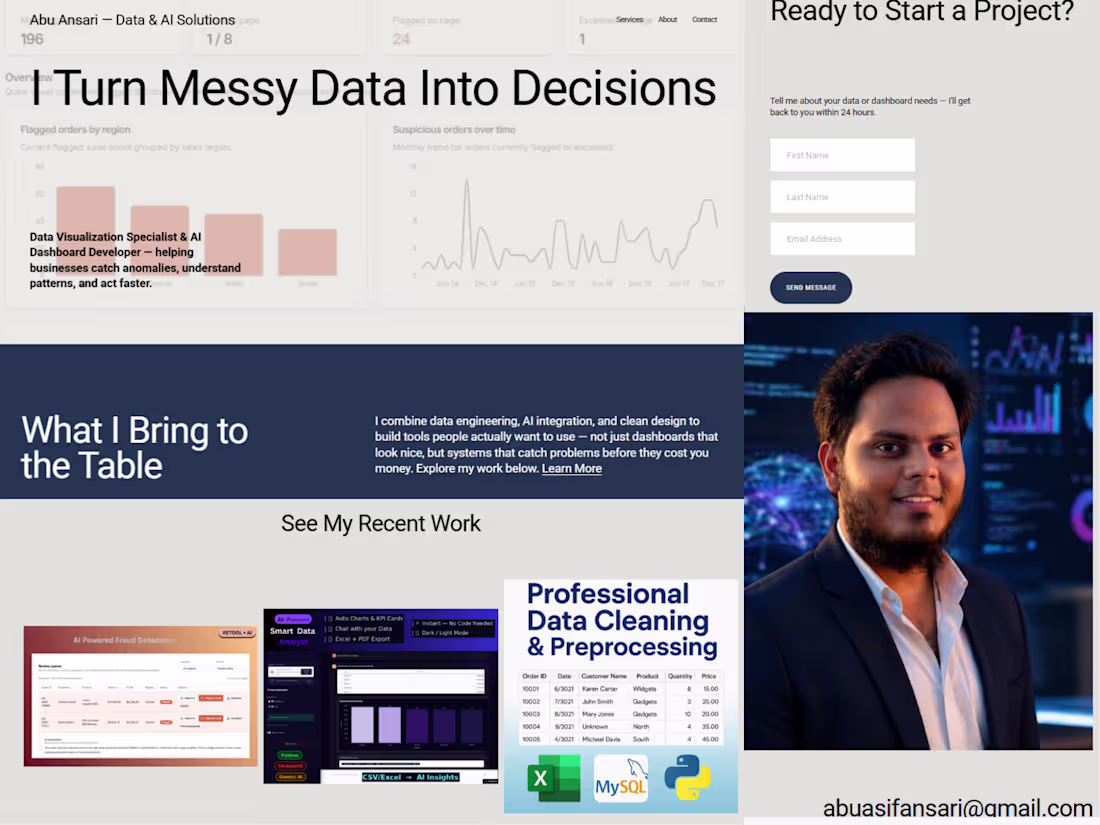
This is a personal portfolio and services site built for a working freelancer — myself — as part of the Make It Real Challenge. I'm a data visualization specialist and AI dashboard developer, and I wanted the site itself to reflect that work rather than just describe it. So instead of stock photography and generic copy, every visual on the site is a real screenshot from a project I've actually shipped.
The Concept
Most freelance portfolio sites lean on polished lifestyle photography — laptops on wooden desks, people in blazers looking thoughtfully at monitors. I wanted to flip that: let the actual product screens do the talking. The site is built around a simple idea — "solutions built on data, not guesswork" — and that shows up literally in the visuals, not just the copy.
What's on the site
Homepage: A direct hero statement ("I Turn Messy Data Into Decisions") backed immediately by a real dashboard screenshot from my Anomaly Review & Action Console, followed by a "recent work" section pulling in three separate real projects.
Services page: Four core offerings — Anomaly Detection Dashboards, Power BI & Data Analytics, AI-Integrated Internal Tools, and Custom Data Automation — each paired with an actual screenshot of that specific project (not a mockup).
About page: A short, direct bio and a real photo, no filler.
Contact page: A simple inquiry form paired with a data-visualization graphic that matches the site's overall theme.
How I used Finish Layer
Block Animations: I used on-appear and on-scroll triggers (Reveal and Slide styles) across the homepage, services, and contact pages. Section headings reveal as the page loads, and content blocks slide/fade in as the visitor scrolls — this turns what would be a static, all-at-once page into a guided, paced experience.
Block Transform: Rather than a flat grid, I applied a subtle rotation to a couple of key visuals (a dashboard screenshot and the contact-page graphic) — just a few degrees, enough to break the rigidity of the layout without sacrificing readability. It gives the page an asymmetrical, more intentional feel instead of looking templated.
Process
I built this using Squarespace's Blueprint AI to get a fast base structure, then went through every page replacing AI-generated placeholder content (stock imagery, generic service descriptions, an accidental product/ecommerce section) with real project data, real screenshots, and copy that actually reflects how I work with clients. The site is password-protected rather than published on a paid plan, and is fully responsive across desktop and mobile.
Access:
🔗 Site: https://pike-megalodon-4yb2.squarespace.com
(https://pike-megalodon-4yb2.squarespace.com)🔑 Password: Omega
2
256
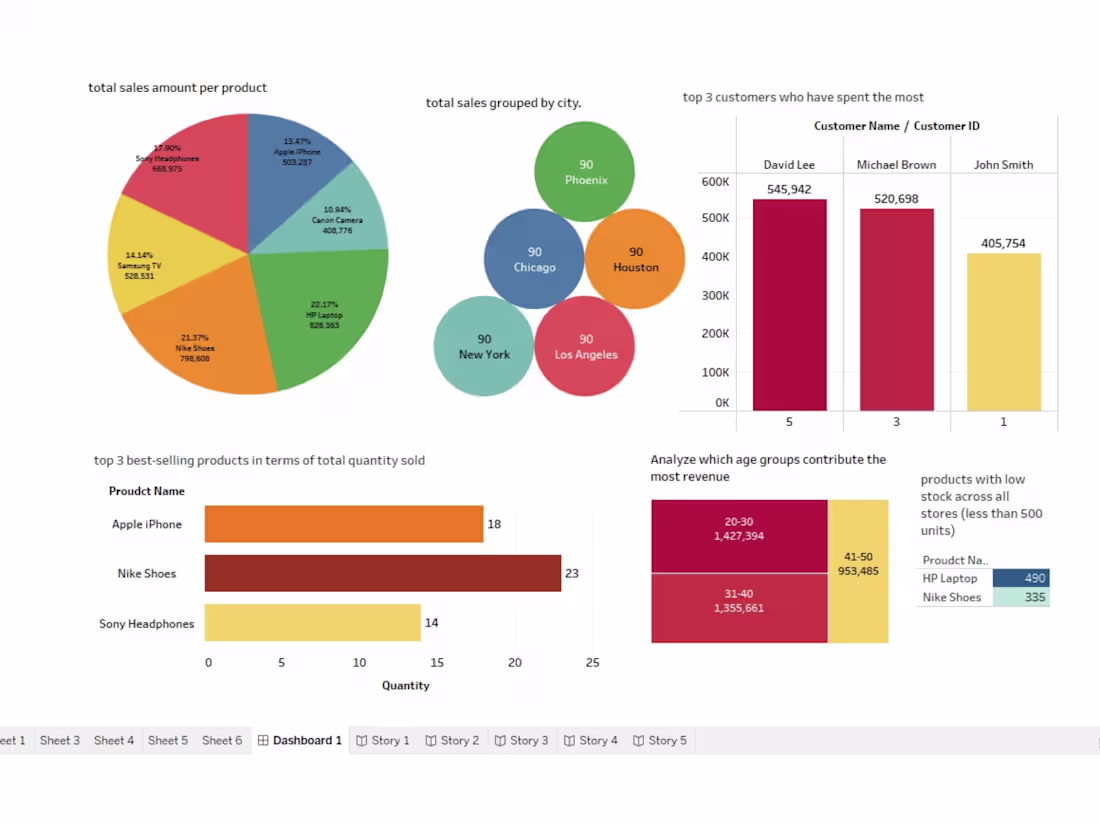
Retail Store Sales Analysis (SQL + Tableau)
I built a sales analytics project for a fictional retail chain, OmegaEnterprise, to analyze revenue performance, customer behavior, and inventory trends using SQL and Tableau.
Project Goals
Identify top customers and best-selling products
Analyze monthly sales trends and city-wise performance
Monitor inventory levels to support stock decisions
What I Did
Joined Customers, Products, Sales, and Inventory tables using SQL
Used aggregations, subqueries, and CTEs to generate insights
Prepared datasets and created Tableau dashboards
Key Insights
Identified top revenue-contributing customers
Highlighted high-demand products with inventory shortages
Tools used:
SQL, Tableau
0
91
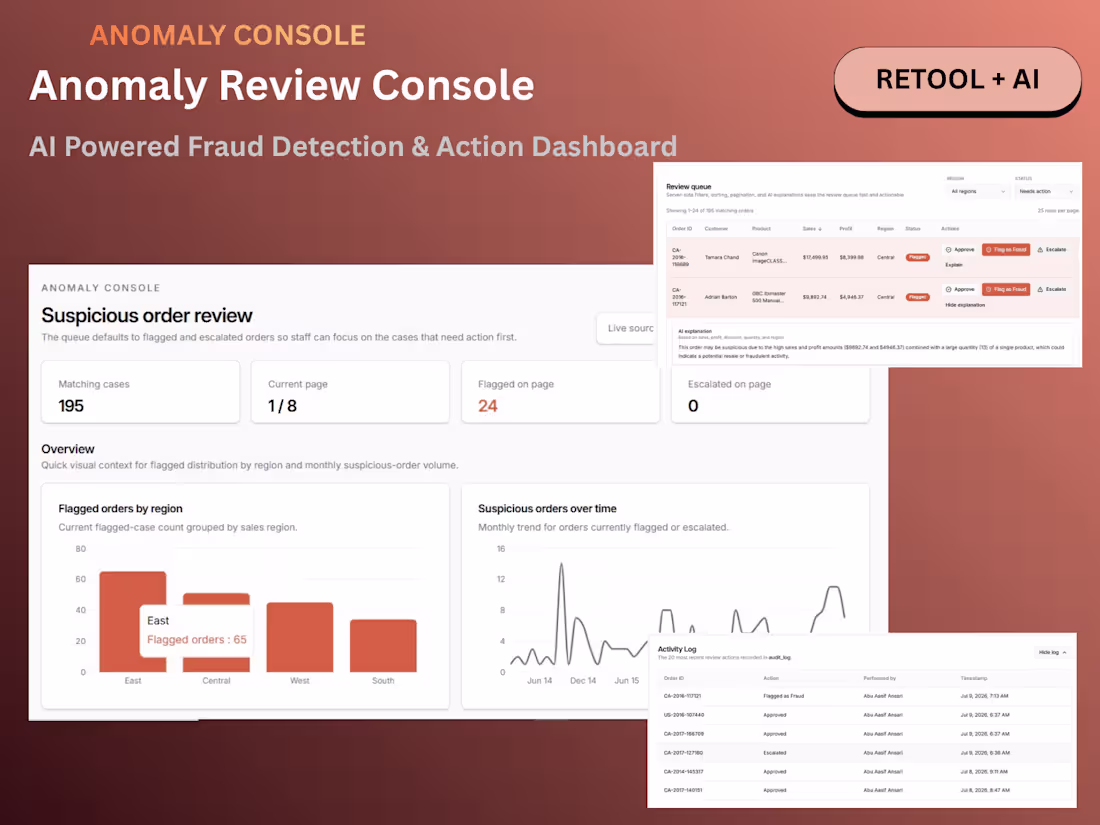
Anomaly Review & Action Console (Retool + AI)
1
5
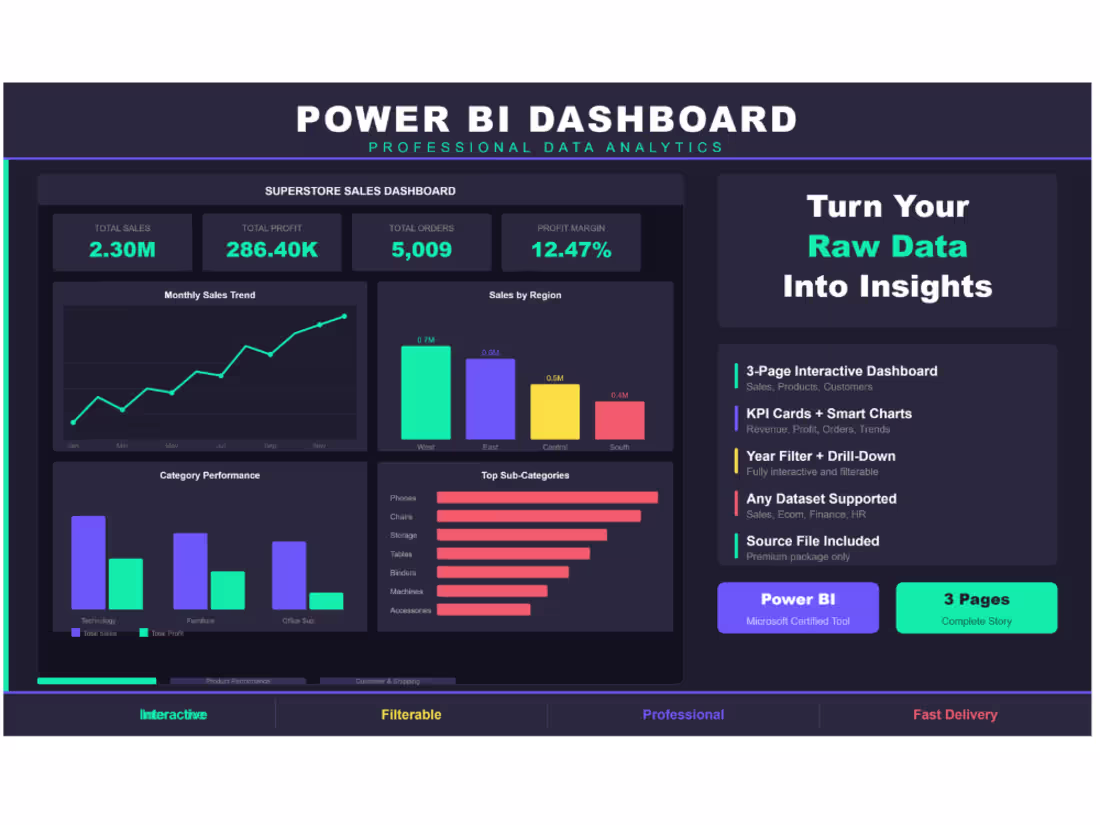
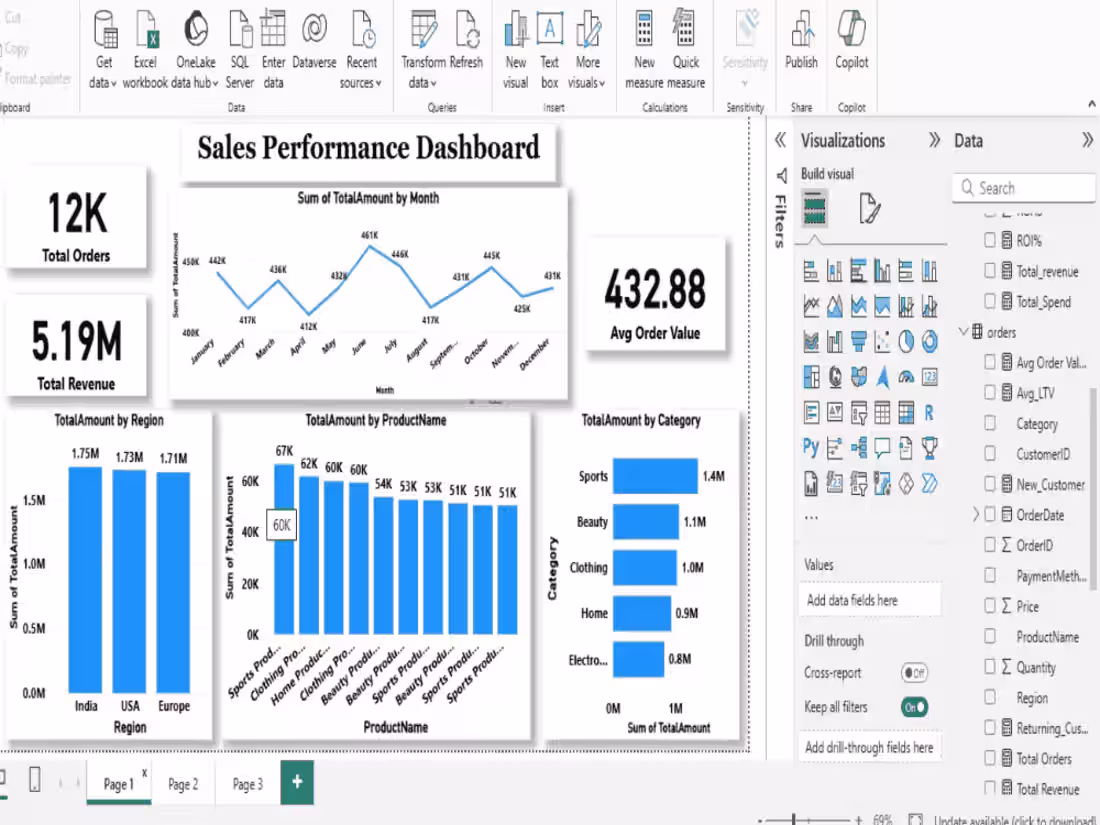
Superstore Sales Dashboard — 3-Page Power BI Report
Built an interactive 3-page Power BI dashboard using
the Superstore Sales dataset (9,994 orders across USA).
Page 1 — Sales Overview: KPI cards, monthly trend,
regional breakdown, category performance.
Page 2 — Product Performance: Top products, category
donut, profit analysis, sales vs profit scatter.
Page 3 — Customer & Shipping: Segment breakdown,
top 10 customers, monthly growth, ship mode distribution.
Tools: Power BI, DAX, Superstore Dataset
Theme: Dark professional with interactive year filter.
0
156

AI-Powered Data Cleaning Tool Development
1
8
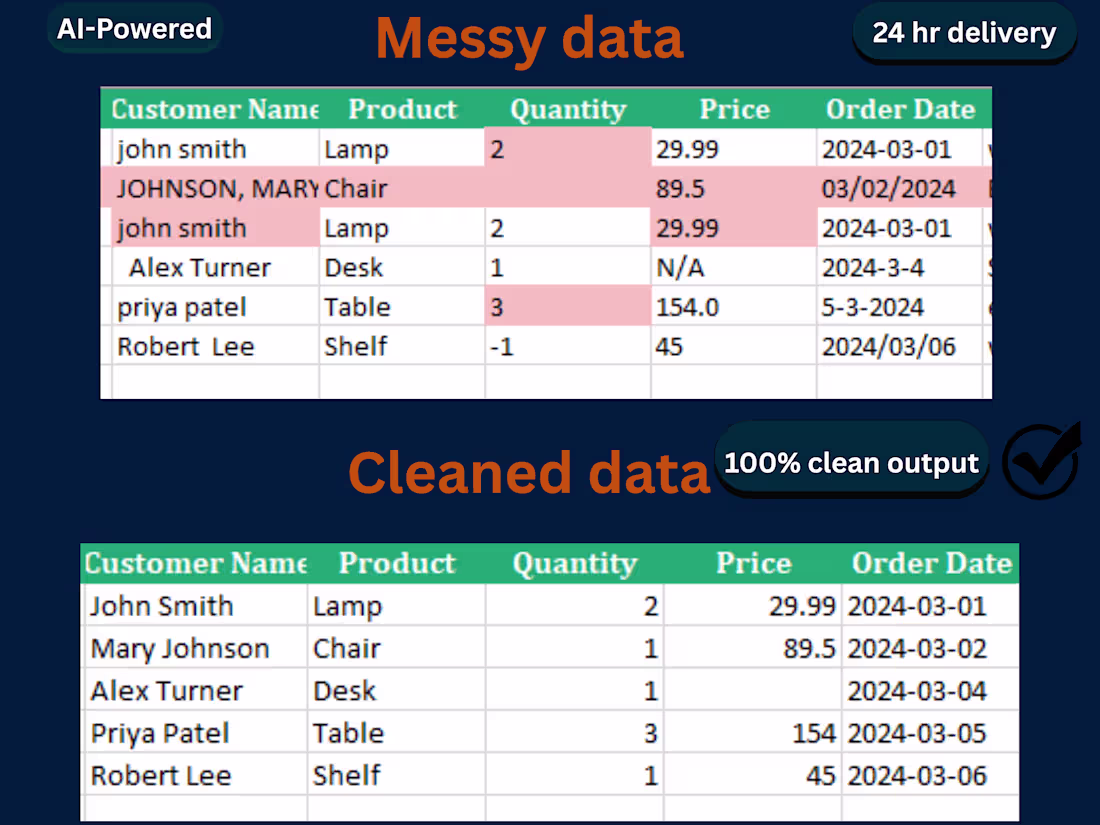
AI-Powered Data Cleaning Tool
1
5
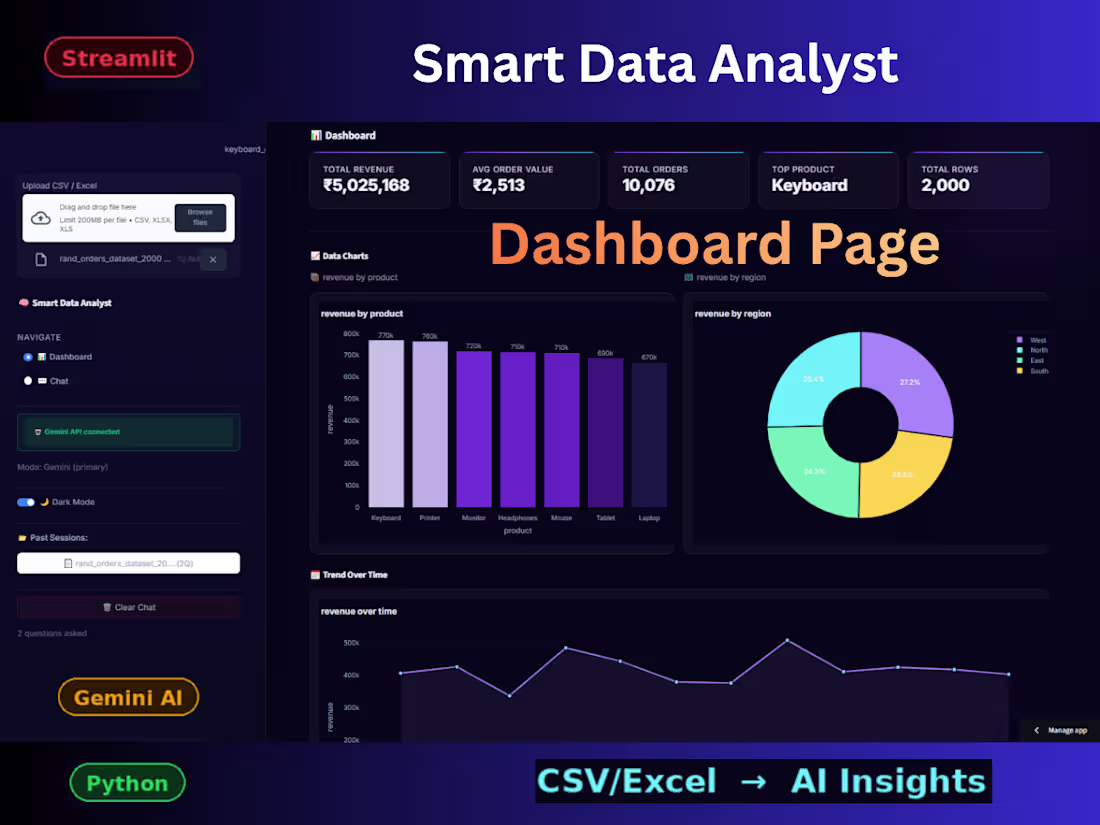
Smart Data Analyst — AI-Powered Data Analysis App
1
4
PersonaSkill AI — Career Assessment Tool
1
10
DataStory turns any CSV into a visual story your audience can actually understand. Upload data, pick your audience — Business, NGO, Student, or Social Media — and instantly get charts, AI insights, and a narrative in the right tone.
🔗 Live App: gloss-pink-92515363.figma.site (http://gloss-pink-92515363.figma.site)
🎨 Figma File: https://www.figma.com/make/3fXa18CiqXMh5DGpDEJB2b/DataStory-web-app?t=x2aGr4k1EKKAyKHl-1
📱 LinkedIn Post: https://www.linkedin.com/posts/abuaasif_configmakeathon-figmamake-datavisualization-ugcPost-7468777281721638912-euQR/?utm_source=share&utm_medium=member_desktop&rcm=ACoAACRm5rcB0nVG0_HUX6-IXfuWqNGquZ-jMQU
Built with Figma Make + Supabase.
2
5
1K
DataStory turns any CSV into a visual story your audience can actually understand. Upload data, pick your audience — Business, NGO, Student, or Social Media — and instantly get charts, AI insights, and a narrative in the right tone.
🔗 Live App: gloss-pink-92515363.figma.site (http://gloss-pink-92515363.figma.site)
🎨 Figma File: https://www.figma.com/make/3fXa18CiqXMh5DGpDEJB2b/DataStory-web-app?t=8gpa5UvsYyDBd1RP-1
📱 LinkedIn Post: https://www.linkedin.com/posts/abuaasif_configmakeathon-figmamake-datavisualization-activity-7468491109715935232-htUB?utm_source=share&utm_medium=member_desktop&rcm=ACoAACRm5rcB0nVG0_HUX6-IXfuWqNGquZ-jMQU
Built with Figma Make + Supabase.
8
13
3K
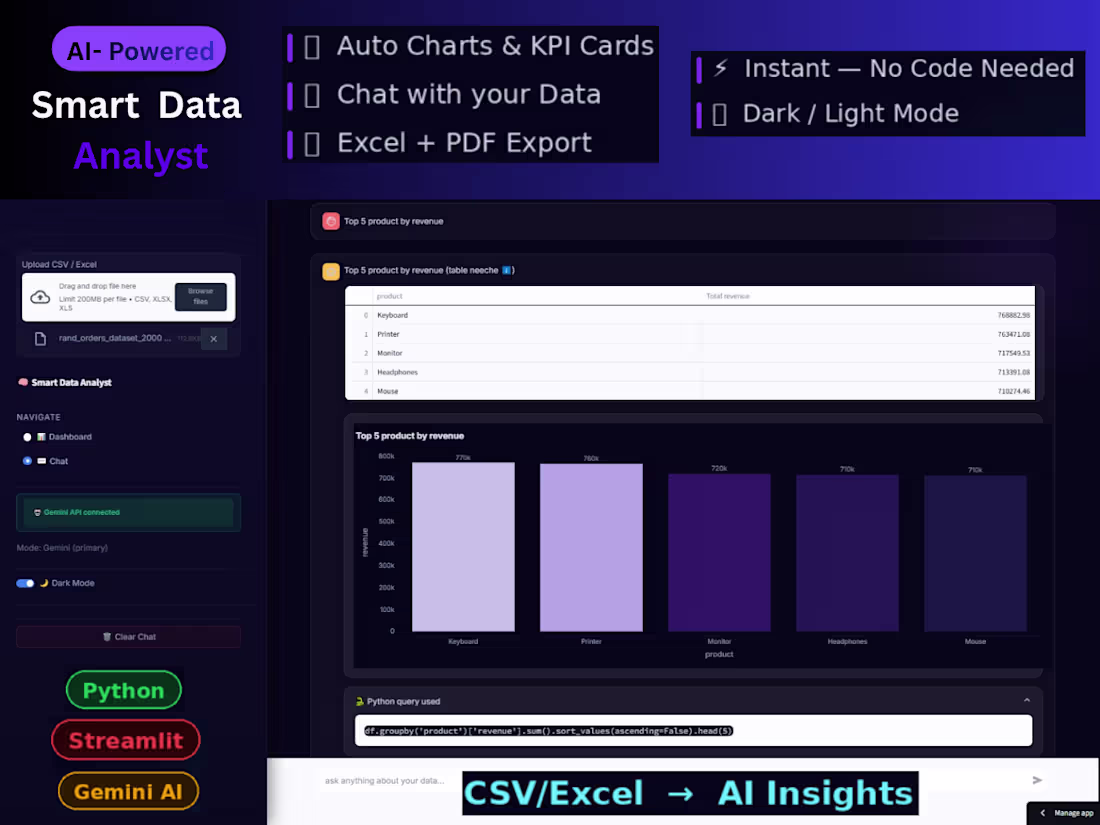
Smart Data Analyst — AI-Powered Data Analysis App
Built a fully working AI-powered data analysis app
from scratch using Streamlit and Gemini API.
The problem: Most business owners have data in
Excel or CSV files but no easy way to analyze it
without hiring a full-time analyst or learning Python.
So I built a tool where you just upload your file
— and the app does the rest.
→ Auto-detects KPIs from any dataset
→ Generates charts automatically
→ Ask questions in plain English — get instant
answers with tables and charts
→ Downloads full PDF report with KPIs and charts
→ RAG memory — remembers past questions
Tech: Streamlit · Gemini API · Python · Pandas · Plotly
🔗 Live: https://smart-data-analyst-ahkz32vjd6dzvhmexkrhdm.streamlit.app/
(https://smart-data-analyst-ahkz32vjd6dzvhmexkrhdm.streamlit.app/)⭐ GitHub: https://github.com/AbuAsifAnsari/smart-data-analyst
(https://github.com/AbuAsifAnsari/smart-data-analyst)
0
401
Sales, Customer & Marketing Analytics Dashboard Project
1
9
I’m a Data Analyst specializing in cleaning, structuring, and analyzing marketing and sales data using Python, Excel, SQL, and Power BI.
I help businesses fix broken data pipelines, resolve formatting issues, and turn raw data into accurate dashboards that support decision-making.
My work focuses on clarity, reliability, and scalability—ensuring reports remain consistent as data grows.
If you’re struggling with inconsistent data or dashboards that don’t reflect reality, I can help streamline the process end-to-end.
0
463
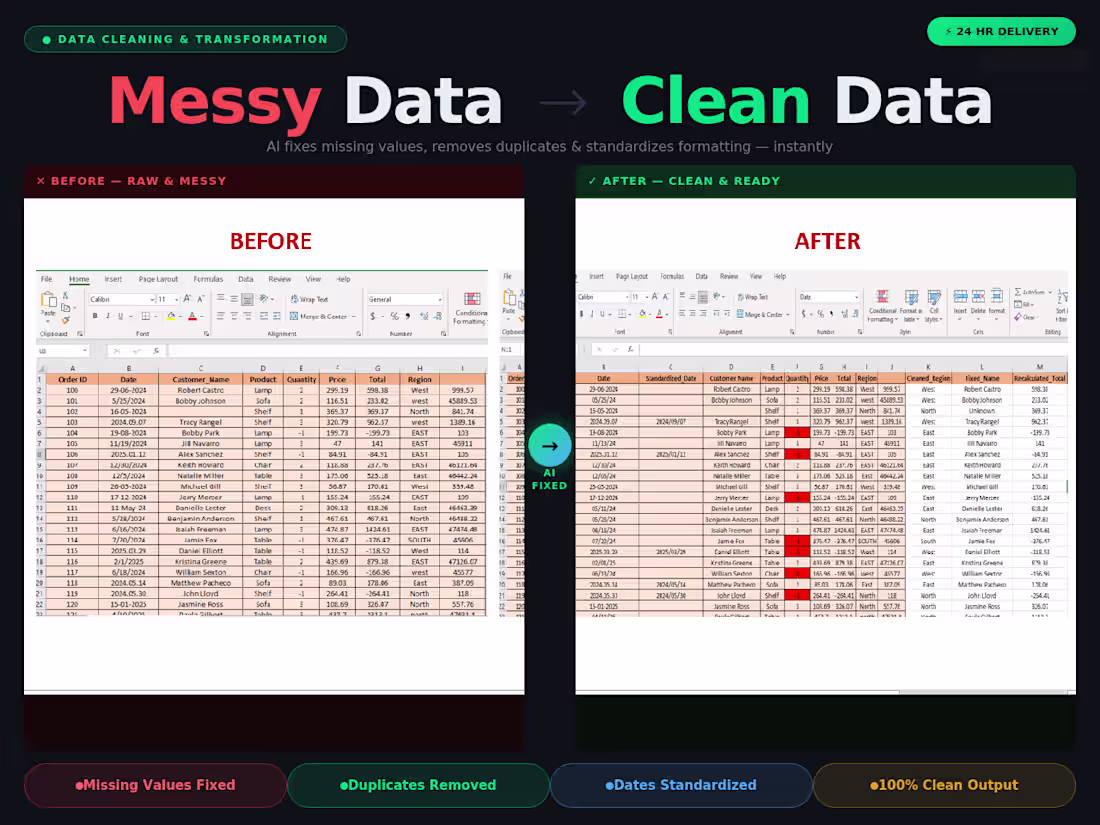
I specialize in data cleaning and preprocessing, ensuring your spreadsheets or databases are accurate, well-formatted, and ready for analysis or reporting.
What Ill do for you:
Remove duplicates, nulls, and inconsistencies
Standardize date, text, and numeric formats
Fix spelling/case issues
Split/merge columns (e.g., names, addresses)
Convert file formats (CSV Excel SQL)
Python or SQL-based advanced cleaning (if required)
Supported formats: Excel, CSV, Google Sheets, SQL dumps
Clean, fast & confidential service
100% satisfaction guaranteed
Message me before ordering so I can understand your dataset and goals!
0
510
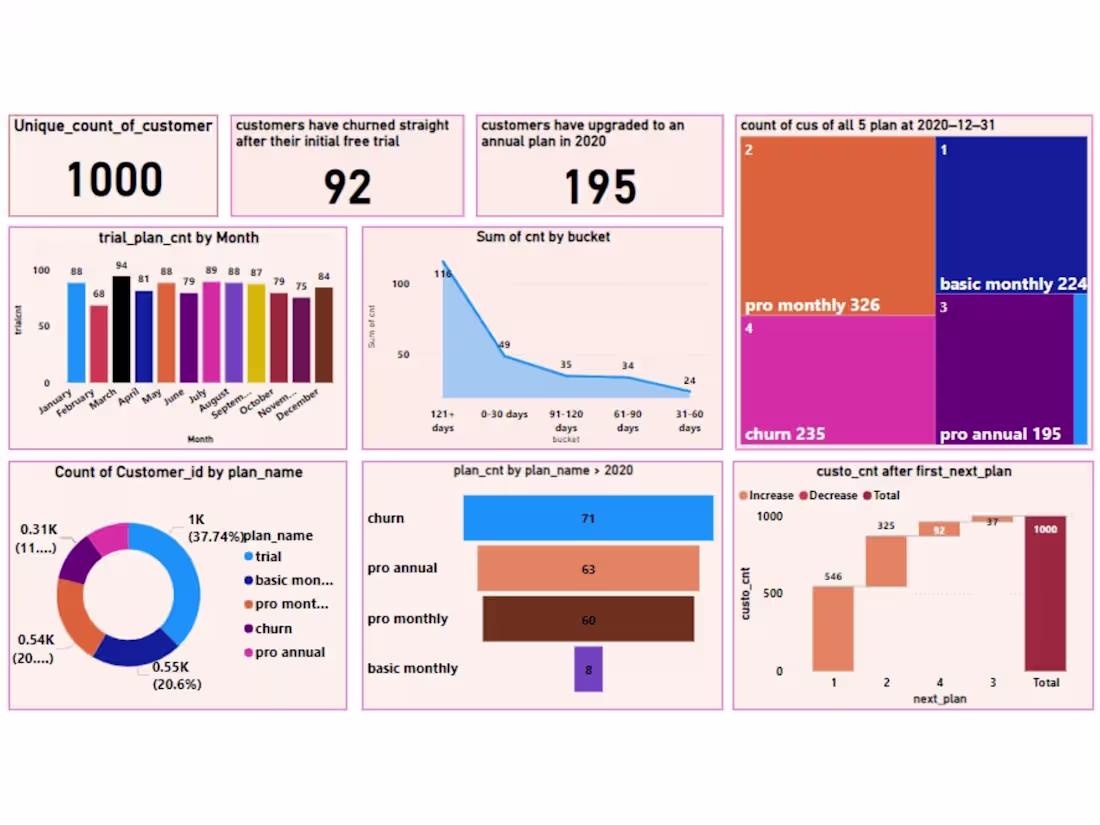
Data Analytics Project – Subscription Model Analysis (SQL & Power BI)
Analyzed a subscription-based business model for Foodie-Fi (TastyStream), a digital platform offering on-demand global cuisine content. The objective was to understand customer journeys, subscription transitions, and revenue performance using SQL and Power BI.
Key Contributions & Insights:
Segmented customers based on trial-to-paid and plan transitions.
Analyzed free trial behavior and conversion patterns.
Evaluated revenue performance across subscription plans.
Built interactive dashboards in Power BI for actionable insights.
Tools Used:
MYSQL, Power BI
Outcome:
Delivered a clear, insight-driven dashboard supporting data-driven decisions in a subscription-based business.
2
442
🚀 SQL & Tableau Project | Sales Analytics Dashboard
To practice real-world analytics, I built an interactive Sales Analytics Dashboard using SQL & Tableau to analyze sales performance and customer behavior.
🔹 Dataset Highlights
OrderID, CustomerID, Product, Category, Sales, Quantity, Discount, Profit, Region, OrderDate
🔹 Dashboard Coverage
• Sales overview: Total Sales, Profit & Orders
• Product performance: Top-selling products & category insights
• Monthly sales trends
🔹 Tools Used
• SQL
• Tableau
🔹 Key Insights
• A small customer segment drives most revenue
• Certain product categories consistently outperform others
• Clear seasonal sales patterns
🔹 What I Learned
• Writing efficient SQL queries for analysis
• Translating numbers into business-friendly visuals
• Designing dashboards that support data-driven decisions
0
379
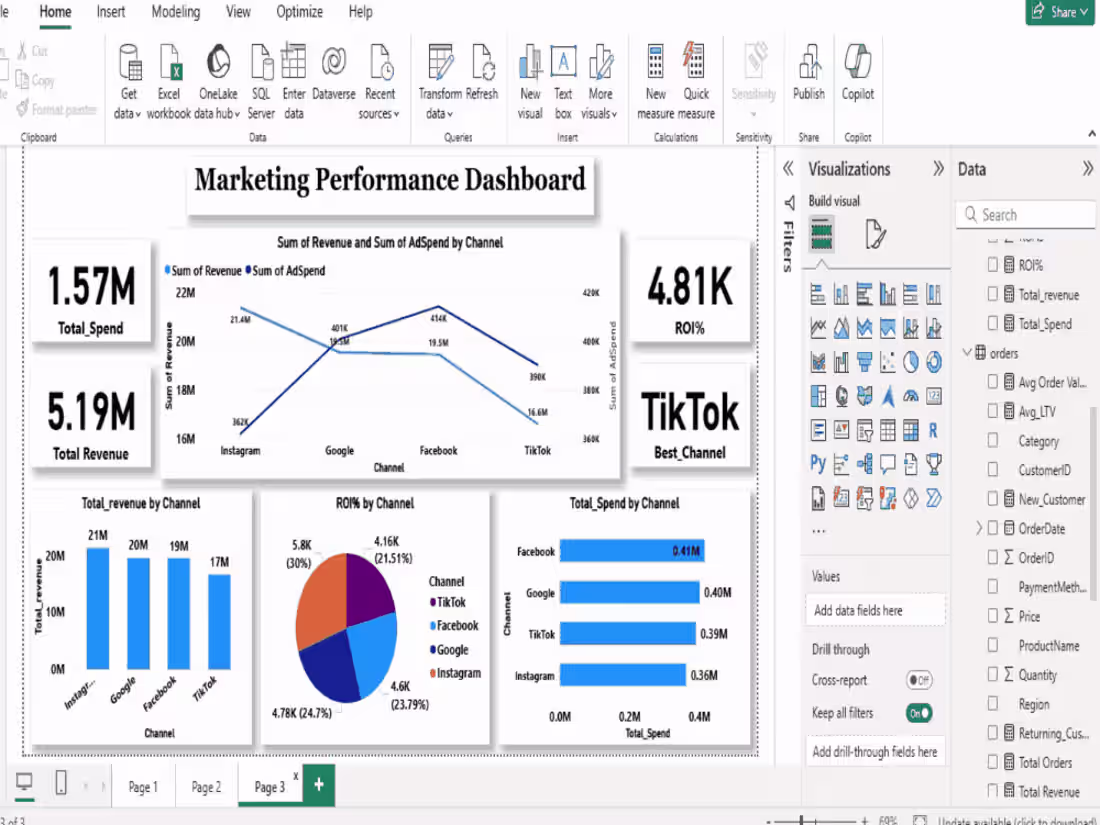
Sales, Customer & Marketing Analytics in Power BI
I built a complete 3-page Power BI dashboard to analyze Sales performance, Customer behavior, and Marketing ROI—all in one place.
🔍 Sales Overview
Revenue trends & top product categories
Total Sales, Orders & Average Order Value
Region-wise and payment method analysis
👥 Customer Insights
New vs Returning customers
Customer Lifetime Value (LTV) by region
Purchase frequency & repeat behavior using DAX
📈 Marketing Performance
Spend vs Revenue across Paid Ads, Social, Referral, Influencer/UGC, Email & Offline
Clear ROI comparison to identify winning and underperforming channels
🛠 Tools Used: Power BI, SQL, DAX, CSV
💡 Outcome:
This project shows how combining Sales, Customer, and Marketing data helps businesses make faster, smarter decisions.
0
328