
Abu Aasif Ansari
I build AI-powered data apps and dashboards
Ready for work
Abu Aasif is ready for their next project!
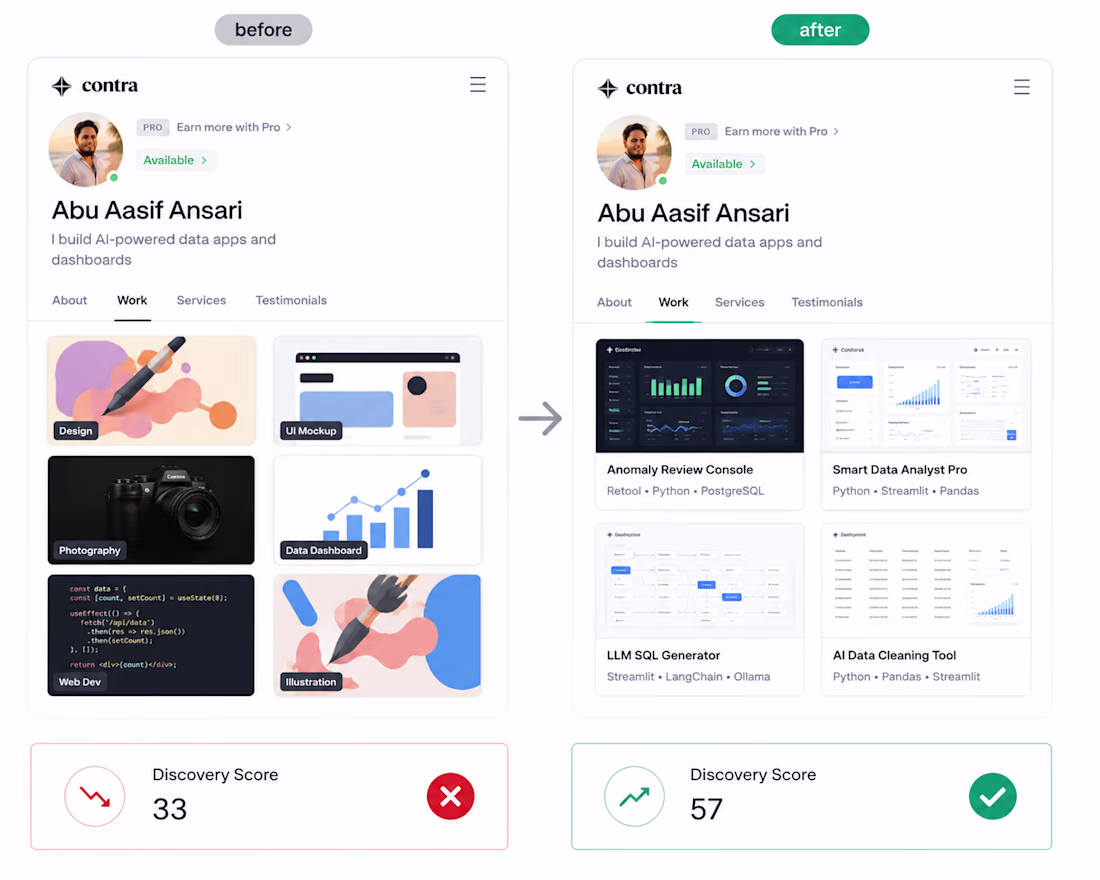
Spent this week doing something I'd been avoiding — actually auditing my own Contra profile instead of just adding projects and hoping for the best 😅
Found my Work tab had a couple of design-adjacent pieces sitting right next to my data/AI work. Algorithm was probably reading...
Project Overview
This is a personal portfolio and services site built for a working freelancer — myself — as part of the Make It Real Challenge. I'm a data visualization specialist and AI dashboard developer, and I wanted the site itself to reflect that work rather than just...
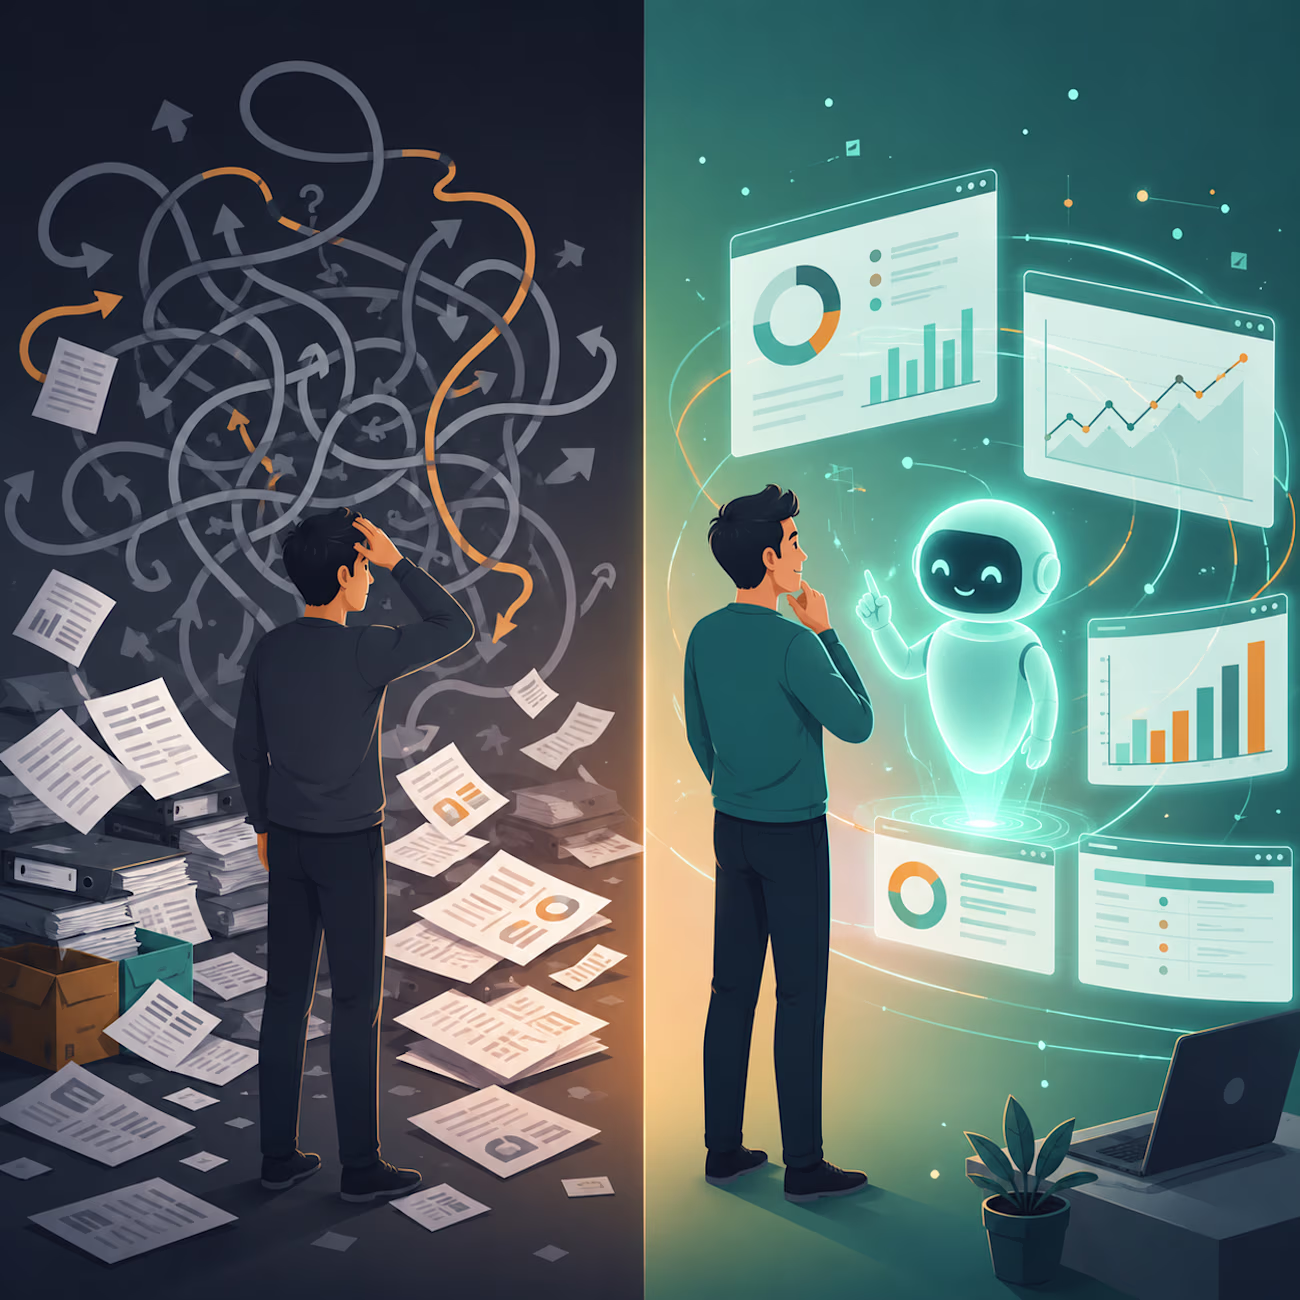
Left side vs right side — most of us have lived in both.
Fun fact that stuck with me: freelancers using AI save close to 9 hours a week on average, and AI-related freelance skill demand grew 109% this past year. Not because AI is replacing anyone — because the people using it...
I gave AI a simple task.
Predict the future.
It did.
But nobody told the analyst...
...that he was the experiment.
48 hours. Zero actors. Zero cameras.
Just me, some prompts, and a plot twist I hope you didn't see coming.
"The Forecast" is my entry for the #RenoiseChallenge —
a...
The Forecast is a 40-second psychological thriller short film built entirely on Renoise. The story follows a South Asian data analyst working late in a dark room, intensely focused on completing a critical forecast. Shot by shot, we see him type, analyze, and finally lean back...