
Wisha Efzaal
Bookkeeping & Financial Analysis | Excel Specialist
New to Contra
Wisha is building their profile!
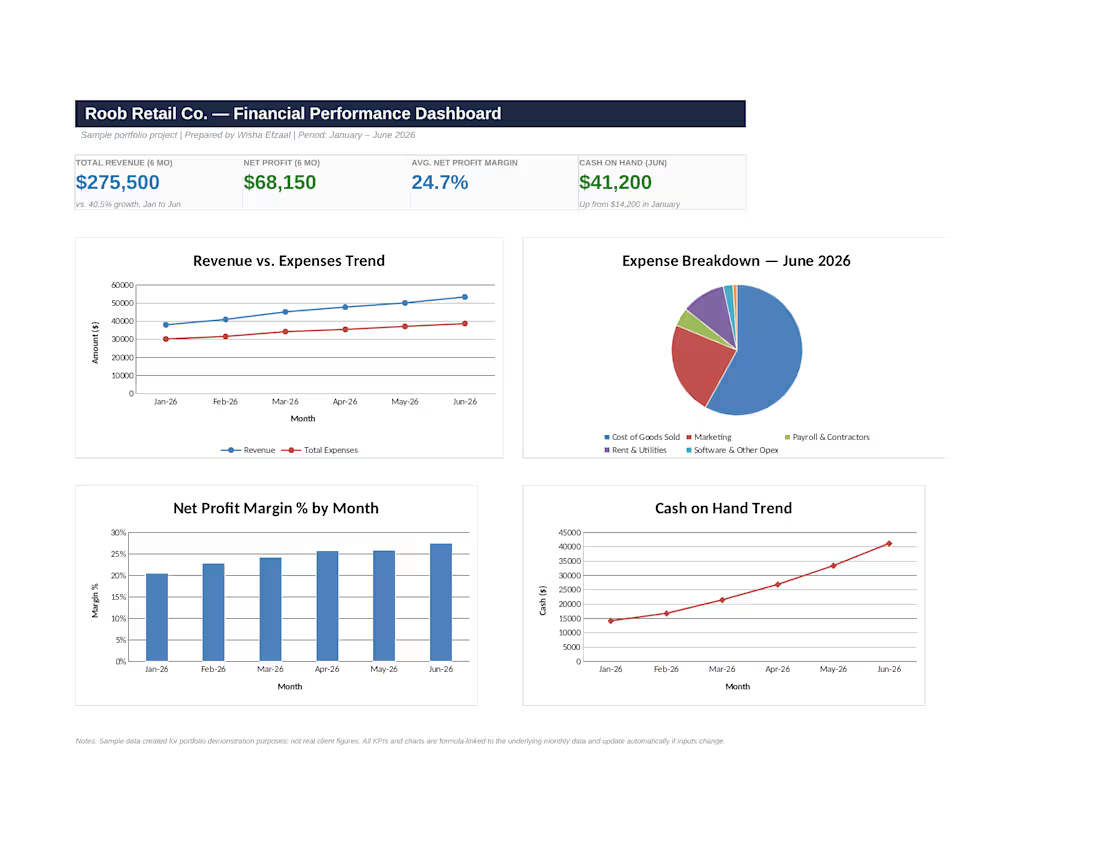
Financial Performance Dashboard
This project turns six months of raw monthly financials into a one-page executive dashboard. I built a hidden data engine sheet holding revenue, expenses, and cash figures, then linked it to a front-end dashboard with four key KPI cards — Total Revenue, Net Profit, Average Profit Margin, and Cash on Hand — that update automatically if the underlying numbers change. The dashboard also includes a Revenue vs. Expenses trend line, an expense breakdown pie chart, a monthly profit margin bar chart, and a cash trend line, giving a business owner a full financial picture at a glance instead of digging through raw spreadsheets. This is the kind of reporting tool I'd build for a small business owner who wants monthly visibility into their numbers without reading a full financial statement.
1
10
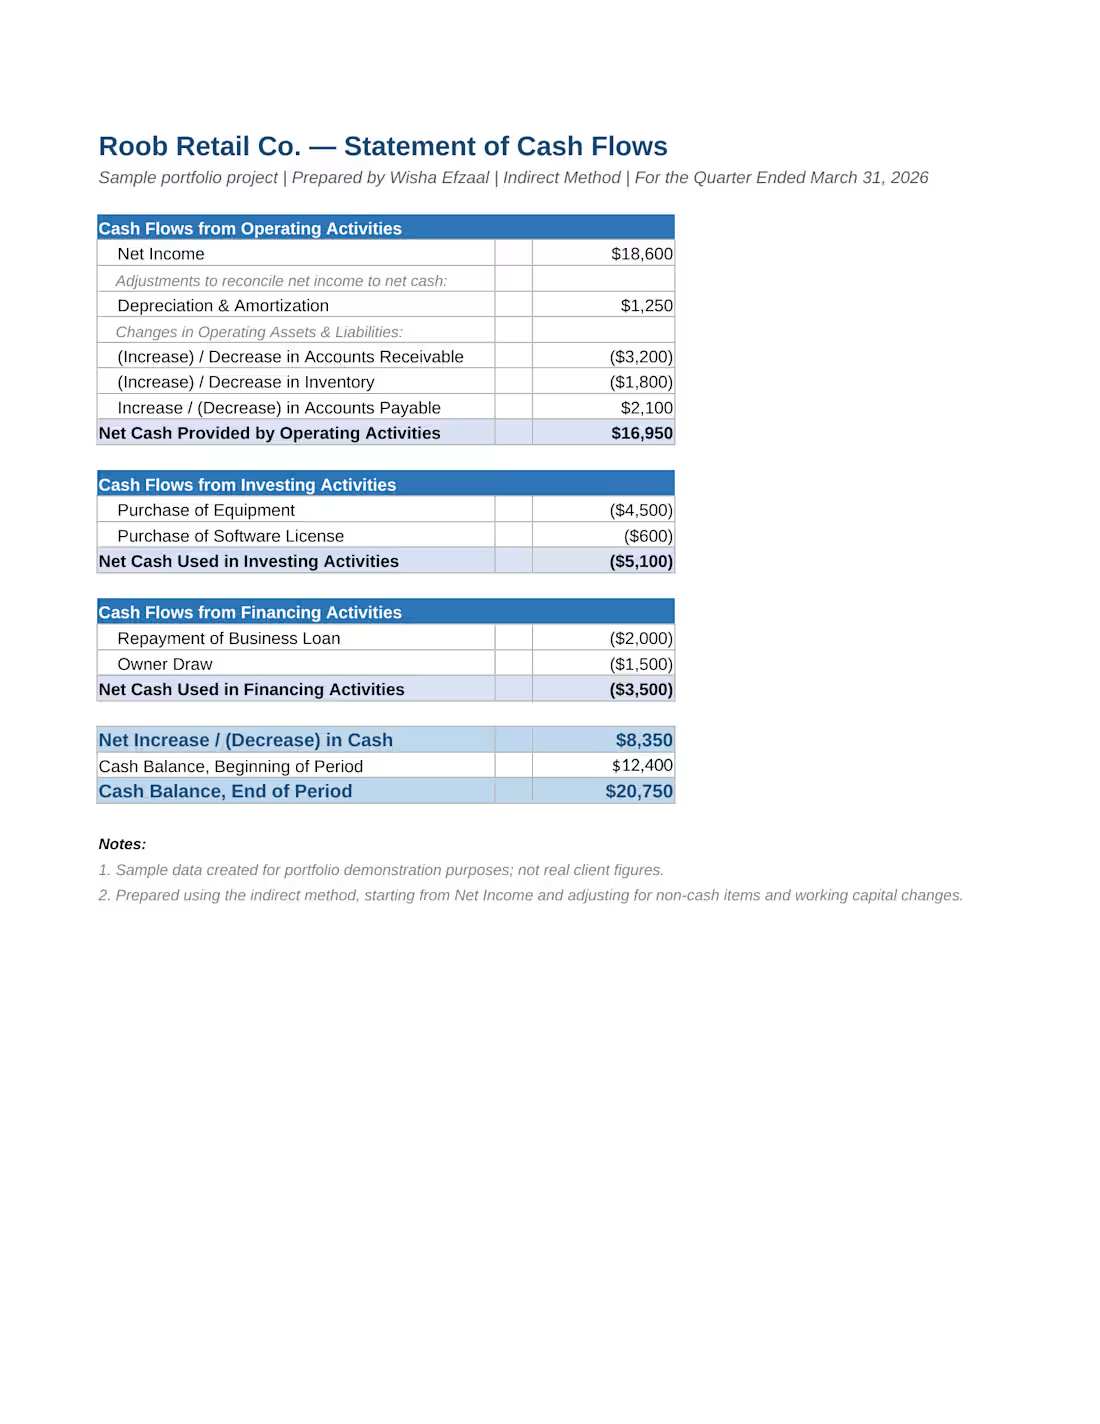
Cash Flow Statement & Cash Flow Forecast
This project covers both historical and forward-looking cash flow analysis for a small retail business. First, I prepared a Statement of Cash Flows using the indirect method — starting from Net Income and adjusting for non-cash items (depreciation) and working capital changes (accounts receivable, inventory, accounts payable) to arrive at Net Cash from Operating, Investing, and Financing Activities. Second, I built a 6-month rolling Cash Flow Forecast that projects monthly cash inflows and outflows, automatically carries each month's ending balance into the next month's beginning balance, and flags any month where projected cash falls below a set minimum threshold. A trend chart visualizes the projected cash position against that threshold, so a business owner can see potential shortfalls months in advance rather than being surprised by them.
1
29
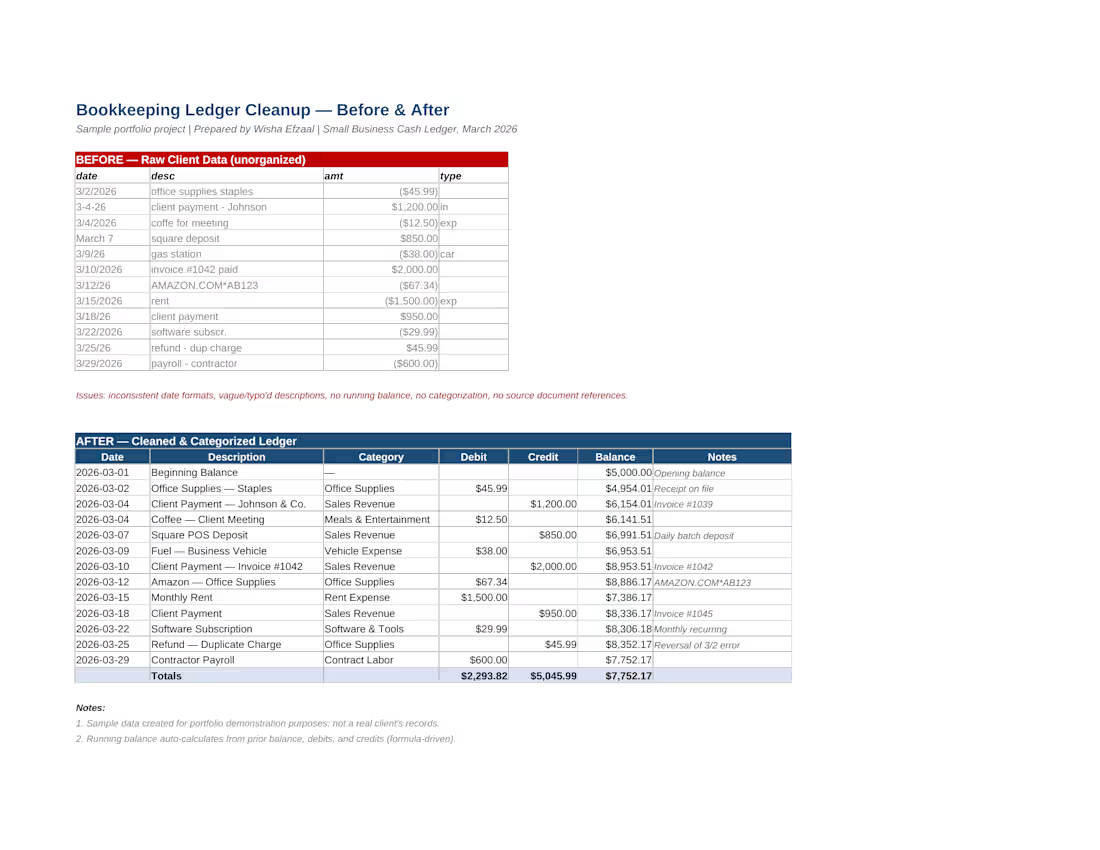
Bookkeeping Ledger Cleanup (Before & After)
This project demonstrates how I approach cleaning up disorganized financial records. Starting from a "before" dataset with inconsistent date formats, vague or typo'd transaction descriptions, and no categorization — a common state for small business books — I rebuilt it into a professional, audit-ready ledger. Each transaction was standardized, correctly categorized (e.g., Office Supplies, Sales Revenue, Rent Expense), and linked to a formula-driven running balance that recalculates automatically as entries are added. This is the kind of cleanup work I'd do for a client whose books have fallen behind or were kept inconsistently, turning scattered data into something an accountant, tax preparer, or business owner can actually rely on.
1
30
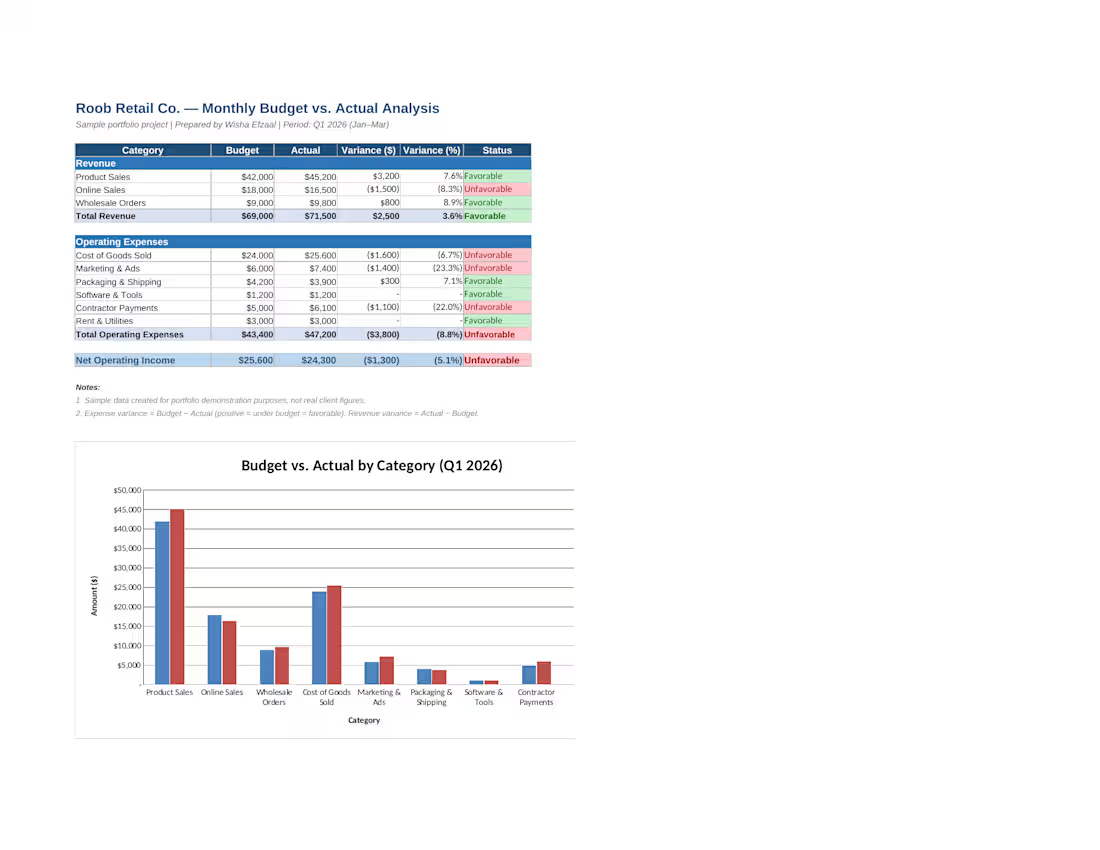
Budget vs. Actual Analysis
This project analyzes a small retail brand's Q1 2026 performance by comparing budgeted figures against actual revenue and expenses. I built a fully formula-driven Excel model — no hardcoded numbers — that automatically calculates dollar and percentage variance for each category, flags results as "Favorable" or "Unfavorable" with color-coded formatting, and rolls everything up into Total Revenue, Total Operating Expenses, and Net Operating Income. A clustered bar chart visualizes budget vs. actual side-by-side for quick executive review. The goal was to show how a business owner could spot exactly where they overspent or outperformed expectations at a glance, without digging through raw numbers.
1
45