The network for creativity
Join 1.25M professional creatives like you
Connect with clients, get discovered, and run your business 100% commission-free
Creatives on Contra have earned over $150M and we are just getting started
Back to feedPost

Financial Performance Dashboard
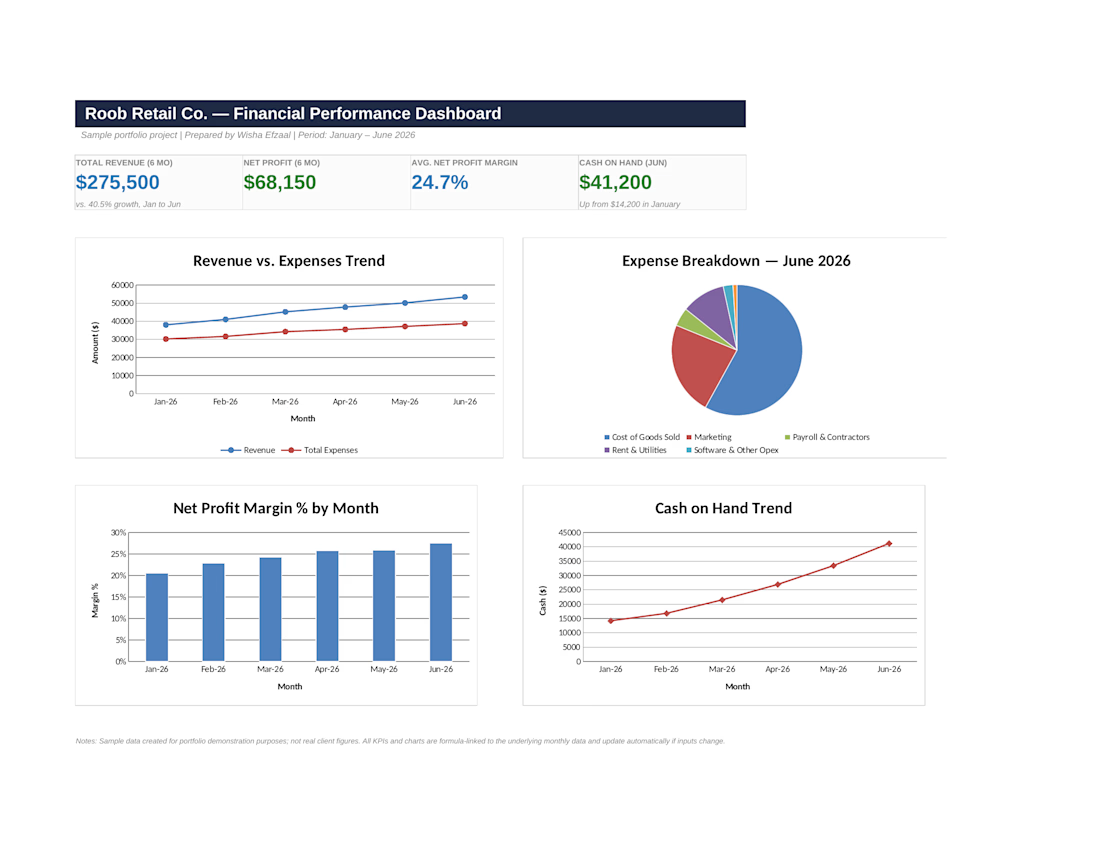
This project turns six months of raw monthly financials into a one-page executive dashboard. I built a hidden data engine sheet holding revenue, expenses, and cash figures, then linked it to a front-end dashboard with four key KPI cards — Total Revenue, Net Profit, Average Profit Margin, and Cash on Hand — that update automatically if the underlying numbers change. The dashboard also includes a Revenue vs. Expenses trend line, an expense breakdown pie chart, a monthly profit margin bar chart, and a cash trend line, giving a business owner a full financial picture at a glance instead of digging through raw spreadsheets. This is the kind of reporting tool I'd build for a small business owner who wants monthly visibility into their numbers without reading a full financial statement.

The network for creativity
Join 1.25M professional creatives like you
Connect with clients, get discovered, and run your business 100% commission-free
Creatives on Contra have earned over $150M and we are just getting started
Trending
retrofuturism
Share your favorite designs from the past exploring the distant future. Or your own take on the aesthetic 🚀
halftone
Dots. Texture. Grain. Let's see your designs using the halftone technique.

Midjourney
Creatives are showing off what they're making with Midjourney.
colorgrade
Video editors sound off: How do you enhance the mood of your video in color grading?
Related posts

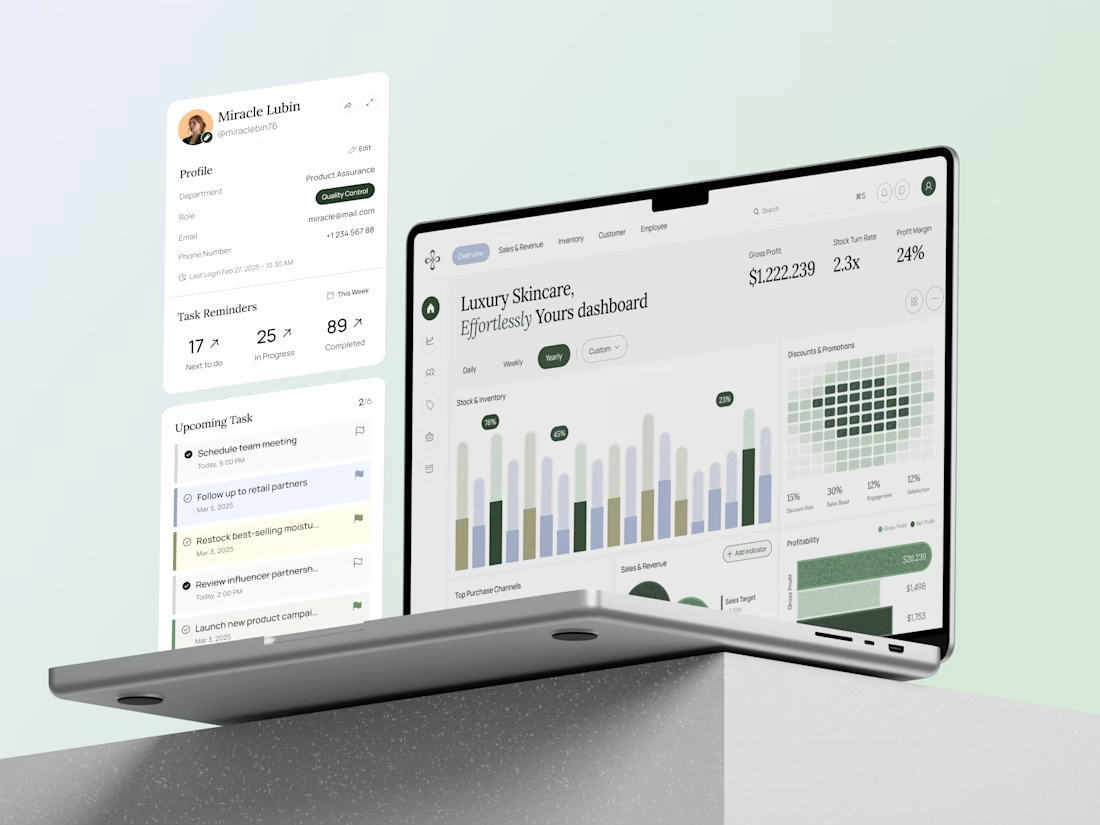
24 hours of tinkering later, the dashboard is finally locked.
I spend a lot of my day on calls, updates and running the studio now, so getting to sit down and set the first design direction still feels like the fun bit.


Very clean dashboard

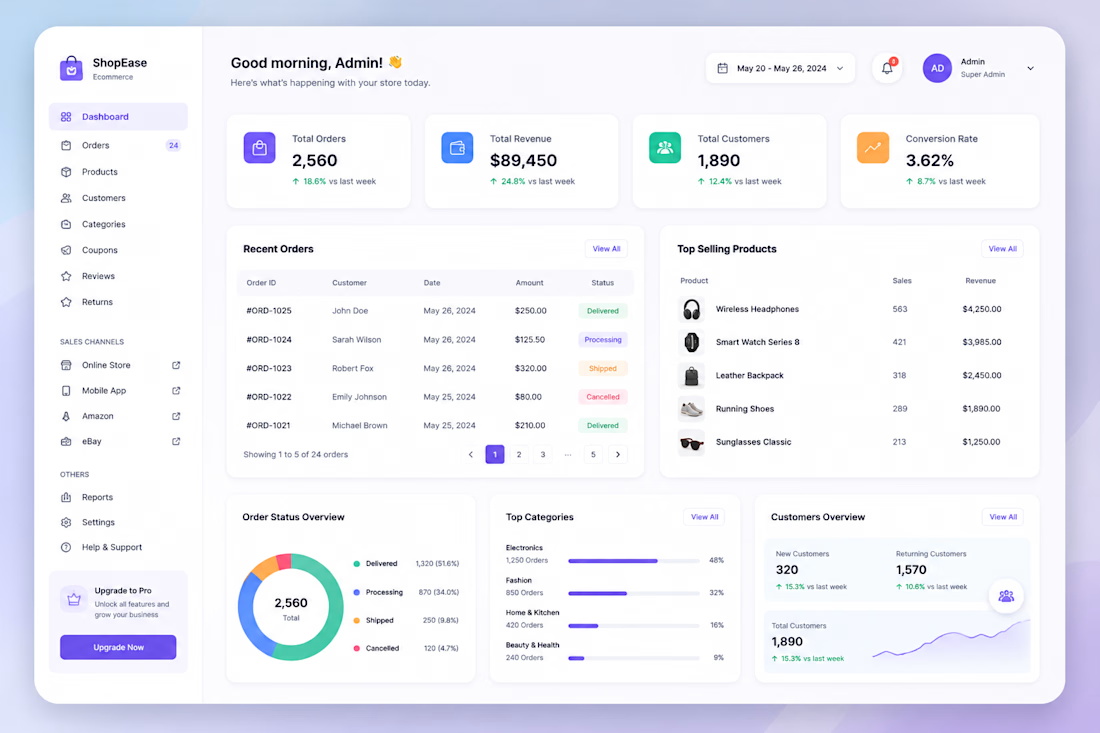
Designed a modern E-commerce Dashboard for seamless store management.
Clean and professional UI featuring sales analytics, revenue tracking, order management, customer insights, top-selling products, and detailed transaction reports — helping businesses make faster, data-driven decisions.


Designed to support Verte’s continued growth, the dashboard not only simplifies internal workflows but also enhances strategic planning—allowing the team to respond swiftly to market changes and ensure a seamless customer experience. With this robust system in place, Verte can confidently scale its operations while staying true to its commitment to innovation, transparency, and skin health.