
VR Mohd Matheen
Business Intelligence & Power BI Expert (Focus on dashboard)
New to Contra
VR Mohd is ready for their next project!
📌 Project Overview
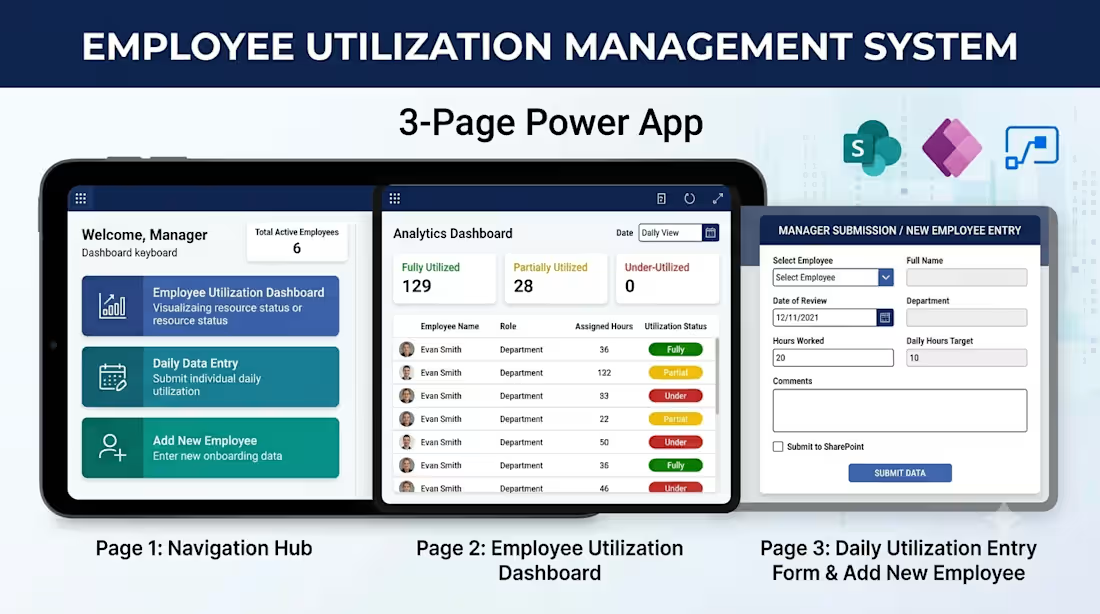
This custom application serves as a single entry point for managers and team leads. It provides an intuitive navigation hub that connects daily utilization dashboards, manager-level submission forms, and new employee onboarding data directly to a centralized SharePoint backend.
📱 Application Structure & Key Pages
1️⃣ Main Navigation Hub (Landing Page)
The primary screen features a clean, user-friendly interface with 3 main navigation controls:
Employee Utilization Dashboard Button: Directs users to the real-time utilization analytics view.
Daily Data Entry Button: Navigates to the manager submission form.
New Employee Onboarding Button: Opens the form to register new employees into the database.
2️⃣ Employee Utilization Dashboard
A centralized monitoring view designed to assess team bandwidth at a glance:
Categorized Bandwidth Tracking: Filters and displays employees categorized by Fully Utilized, Under-Utilized, and Partially Utilized status for any selected day.
Actionable Insights: Enables resource managers to identify available capacity and reallocate project hours effectively.
3️⃣ Daily Utilization Entry Form (Manager Portal)
An efficient form tailored for managers to submit individual employee utilization records:
Manager Submissions: Allows managers to select team members, input hours worked, assign project codes, and log daily status.
SharePoint Integration: Submits entries directly to the backend using optimized form submission logic to ensure data integrity.
4️⃣ Employee Directory & Onboarding Form
A structured data entry interface to expand and maintain the team directory:
New Employee Registration: Captures essential details (Name, Department, Role, Target Capacity, Join Date).
Live Database Sync: Instantly creates a new record in the primary SharePoint Employee List upon submission.
🛠️ Tech Stack & Architecture
Frontend / UI: Power Apps (Canvas App)
Backend Database: SharePoint Online Lists (Employee Master List & Daily Utilization Logs)
Functions & Formulas: Navigate(), SubmitForm(), Patch(), Filter()
📈 Key Benefits & Business Impact
Centralized Navigation: Eliminates complex menus by providing a clean, 3-button landing hub.
Improved Capacity Planning: Gives managers immediate visibility into under-utilized team members to rebalance workloads.
Seamless SharePoint Sync: Ensures reliable, real-time data entry for both daily utilization and employee onboarding.
0
9
Excited to Share a Recent Process Improvement Milestone! 🚀
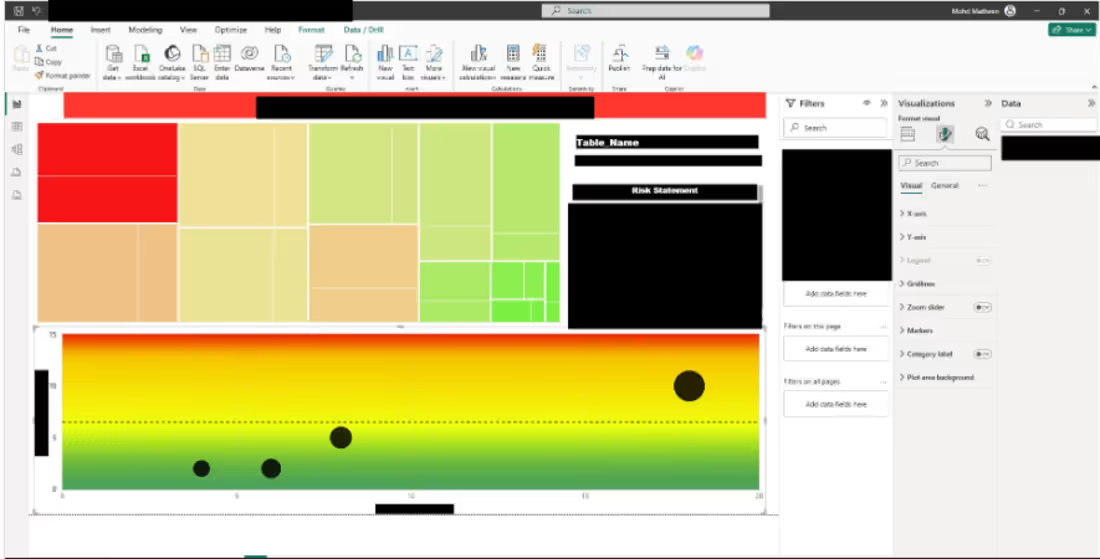
Over the past few weeks, I had the opportunity to work on a highly manual and time‑consuming reporting process involving multiple heatmaps generated from system data. The existing workflow required frequent exports, manual copying of 100+ records, and recreating visuals in presentations — all of which introduced risk and consumed significant effort.
To improve this, I developed a Power BI automated solution that completely removes the repetitive manual steps and delivers dynamic heatmap‑style visuals directly from the source data.
✨ Impact of the Solution
✔ Eliminated manual data handling
✔ Reduced risk of human errors
✔ Delivered real‑time interactive reporting
✔ Achieved an estimated annual savings of USD $80,000 through automation
I’m truly grateful for the encouragement I received during this initiative and the positive feedback on the solution’s effectiveness. It’s always rewarding to see how data, automation, and smart reporting can transform operational efficiency.
As I wrap up my current journey — with my last working day on 13th April 2026 — I’m now actively seeking new opportunities in:
🔹 Business Analytics
🔹 Power BI Development
🔹 Process Automation
🔹 Data Visualization & Reporting
🔹 Project Controls / Risk Insights
If your team is looking for someone with hands‑on expertise in process improvements, dashboarding, automation, and analytical problem‑solving, I’d love to connect.
📩 Please feel free to reach out via LinkedIn or email.
Looking forward to exploring new challenges and contributing to meaningful improvements wherever I go!
0
12
🚀 Interactive Employee Utilization Dashboard: Power BI & Power Apps Integration
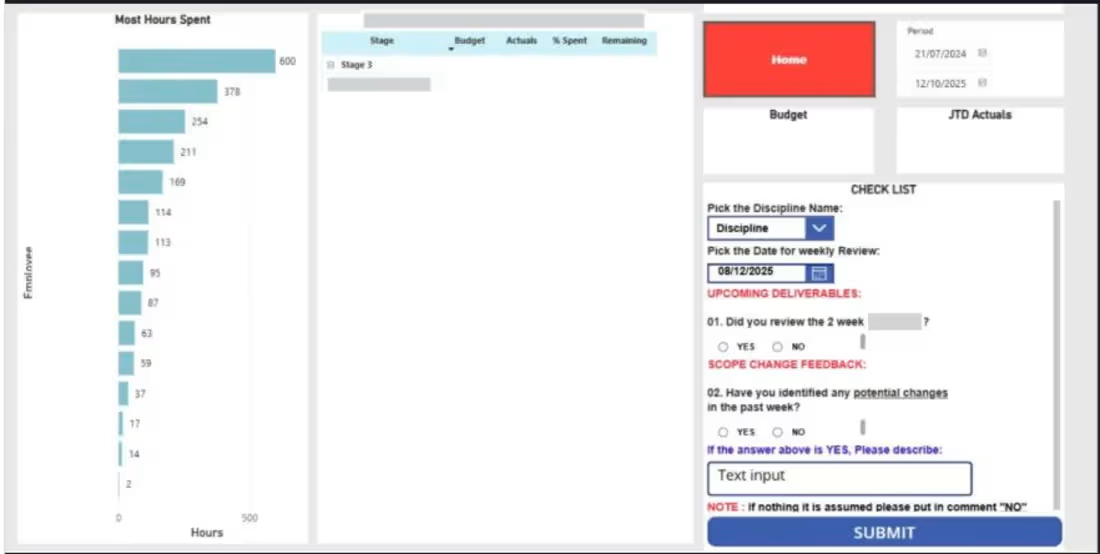
Project managers and top stakeholders often struggle with disconnected reporting and feedback loops. To bridge this gap, I built an end-to-end solution combining Power BI for analytics with an embedded Power App that enables real-time feedback and weekly review submissions without ever leaving the dashboard report.
📌 Business Challenge & Overview
Leadership needed a unified platform to track employee utilization (hours spent, budget vs. actuals, stages) and conduct weekly reviews. The goal was to eliminate manual follow-ups by allowing managers to analyze key metrics and immediately submit feedback or scope change notes in a centralized system.
✨ Key Features & Functionality
Real-Time Analytics in Power BI: Displays key utilization metrics, including "Most Hours Spent" by employee, budget performance, actuals, and stage breakdowns.
Embedded Power App Form: Allows project leaders to perform weekly checklists, select disciplines, set review dates, and input qualitative feedback directly within the report canvas.
Write-Back Data Processing (Patch() Function): Utilizes the Power Apps Patch() function to seamlessly submit user responses and comments directly to an Excel database stored in SharePoint.
Weekly Review Workflow: Tracks scope change feedback and upcoming deliverables in real time, ensuring clear accountability across project management teams.
🛠️ Tech Stack & Architecture
Power BI: Embedded analytics, visual reporting, and data modeling.
Power Apps: Embedded canvas app, form controls, and custom canvas UI.
Power Apps Power Formula: Patch() function for writing data back dynamically.
Data Storage / Backend: Excel file stored on SharePoint for centralized weekly tracking.
📈 Business Impact
Eliminated Context-Switching: Stakeholders can view utilization metrics and log feedback in a single interface.
Streamlined Auditing: Ensures all weekly review notes, scope adjustments, and checklist submissions are systematically stored for weekly audits.
Faster Decision-Making: Bridges qualitative leadership feedback with quantitative utilization data.
0
15
🚀 Automated Data Splitting & Report Generation using Excel VBA
Manually filtering, copying, and saving master datasets into individual rep reports is time-consuming and prone to human error. I designed and implemented a custom Excel VBA automation solution that automates the entire process in just one click.
📌 Project Overview
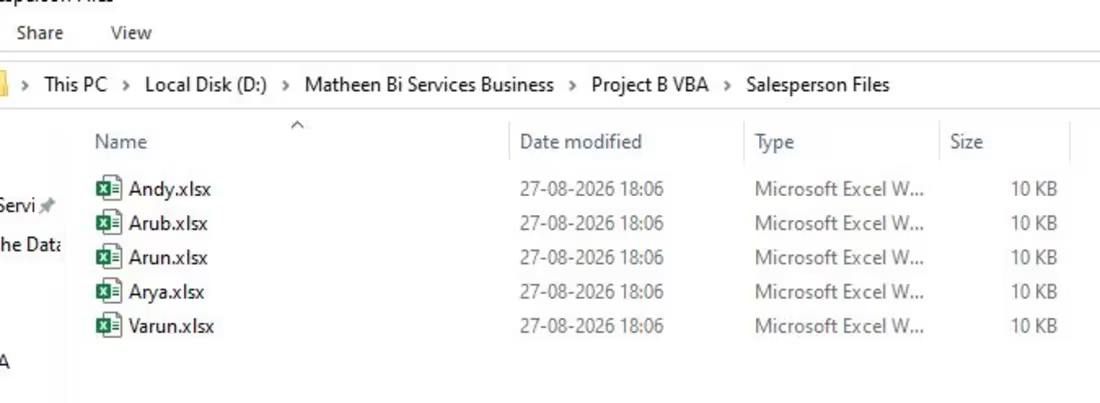
The objective was to take a consolidated master sales report containing transaction records for multiple salespersons and automatically split the data into individual Excel workbooks for each team member.
✨ Key Features & Technical Highlights
Dynamic Data Extraction: Uses VBA Scripting.Dictionary to dynamically identify unique salesperson names from column C without requiring hardcoded values.
Automated File Management: Automatically creates a dedicated output folder (\Salesperson Files\) if it doesn't already exist.
Sanitized File Naming: Includes a helper function (CleanFileName) to replace illegal characters (such as /, \, ?, *) with underscores to prevent file save errors.
Clean Formatting & Auto-Fit: Preserves column headers, applies data filters, copies visible cells, and applies AutoFit formatting on newly generated workbooks (.xlsx) before saving.
Performance Optimized: Temporarily disables ScreenUpdating and DisplayAlerts for faster macro execution and seamless user experience.
🛠️ Tools & Technologies
Language: Excel VBA (Visual Basic for Applications)
Methods Used: AutoFilter, Scripting.Dictionary, SpecialCells(xlCellTypeVisible), File System Manipulation (MkDir, Dir)
📈 Impact & Results
100% Elimination of Manual Work: Reduced hours of repetitive filtering and file creation down to seconds.
Data Accuracy: Ensured each rep receives strictly their own filtered data without risking manual copy-paste errors.
0
18