
Omer Khan
Data Analyst | Power BI, SQL & Excel | Turning Data into Ins
New to Contra
Omer is building their profile!

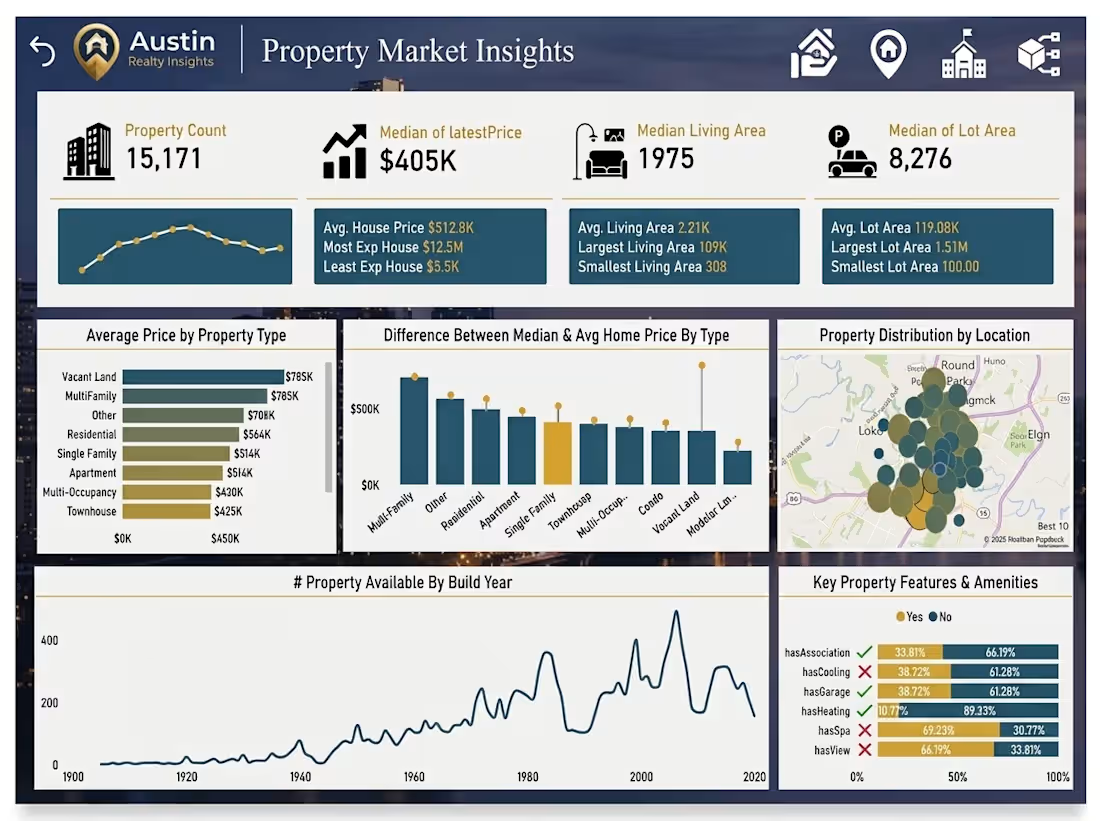
📊 𝗗𝗮𝘆 1/𝟯𝟬 𝗪𝗵𝗮𝘁 𝗰𝗮𝗻 𝗮 𝗿𝗲𝗮𝗹 𝗲𝘀𝘁𝗮𝘁𝗲 𝗱𝗮𝘀𝗵𝗯𝗼𝗮𝗿𝗱 𝗮𝗰𝘁𝘂𝗮𝗹𝗹𝘆 𝘁𝗲𝗹𝗹 𝘆𝗼𝘂? 🏠📊
While working on my 𝗔𝘂𝘀𝘁𝗶𝗻 𝗥𝗲𝗮𝗹𝘁𝘆 project, I started with a simple question:
𝗪𝗵𝗮𝘁 𝗮𝗰𝘁𝘂𝗮𝗹𝗹𝘆 𝗱𝗿𝗶𝘃𝗲𝘀 𝗽𝗿𝗼𝗽𝗲𝗿𝘁𝘆 𝗽𝗿𝗶𝗰𝗲𝘀?
After analyzing 𝟭𝟱,𝟭𝟳𝟭 𝗽𝗿𝗼𝗽𝗲𝗿𝘁𝗶𝗲𝘀, a few things caught my attention:
🏠 𝟭𝟱,𝟭𝟳𝟭 properties analyzed
💰 $𝟰𝟬𝟱𝗞 typical property value
🏢 𝟮+ story properties showed higher values
🚿 Bathrooms & garage capacity also played a role
📍 Location & school ratings showed interesting patterns
The best part? Using 𝗣𝗼𝘄𝗲𝗿 𝗕𝗜 𝗞𝗲𝘆 𝗜𝗻𝗳𝗹𝘂𝗲𝗻𝗰𝗲𝗿𝘀 to dig a little deeper instead of just looking at numbers.
That’s what I enjoy about data 𝗧𝗵𝗲𝗿𝗲’𝘀 𝘂𝘀𝘂𝗮𝗹𝗹𝘆 𝗮 𝘀𝘁𝗼𝗿𝘆 𝗵𝗶𝗱𝗶𝗻𝗴 𝗯𝗲𝗵𝗶𝗻𝗱 𝘁𝗵𝗲 𝗻𝘂𝗺𝗯𝗲𝗿𝘀. 👀
What’s your favorite Power BI feature?
0
8
𝗧𝘂𝗿𝗻𝗶𝗻𝗴 𝗖𝗼𝗳𝗳𝗲𝗲 ☕ 𝗶𝗻𝘁𝗼 𝗜𝗻𝘀𝗶𝗴𝗵𝘁𝘀 📊 | 𝗚𝗿𝗮𝗻𝗻𝘆 𝗖𝗮𝗳𝗲 𝗗𝗮𝘀𝗵𝗯𝗼𝗮𝗿𝗱 𝗥𝗲𝘃𝗲𝗮𝗹 🔥
Hey Contra Fam 👋
Super excited to share my latest project the 𝗚𝗿𝗮𝗻𝗻𝘆 𝗖𝗮𝗳𝗲 𝗘𝘅𝗲𝗰𝘂𝘁𝗶𝘃𝗲 𝗣𝗲𝗿𝗳𝗼𝗿𝗺𝗮𝗻𝗰𝗲 𝗗𝗮𝘀𝗵𝗯𝗼𝗮𝗿𝗱, built using 𝗣𝗼𝘄𝗲𝗿 𝗕𝗜 💻✨
This wasn’t just about creating visuals…
It was about turning raw data into 𝗿𝗲𝗮𝗹 𝗯𝘂𝘀𝗶𝗻𝗲𝘀𝘀 𝗶𝗻𝘀𝗶𝗴𝗵𝘁𝘀 that actually matter 📈
🔥 𝗞𝗲𝘆 𝗛𝗶𝗴𝗵𝗹𝗶𝗴𝗵𝘁𝘀:
💰 $𝟰.𝟯𝟮𝗠 𝗥𝗲𝘃𝗲𝗻𝘂𝗲 𝗚𝗲𝗻𝗲𝗿𝗮𝘁𝗲𝗱
→ Strong month-over-month growth 🚀
🌍 𝗡𝗼𝗿𝘁𝗵𝗲𝗮𝘀𝘁 = 𝗥𝗲𝘃𝗲𝗻𝘂𝗲 𝗞𝗶𝗻𝗴 👑
→ $𝟭.𝟳𝟭𝗠 (~𝟰𝟬%)** contribution
💎 𝟲𝟲% 𝗥𝗲𝘃𝗲𝗻𝘂𝗲 𝗳𝗿𝗼𝗺 𝗟𝗼𝘆𝗮𝗹𝘁𝘆 𝗠𝗲𝗺𝗯𝗲𝗿𝘀
→ Retention is driving the business 💯
📦 Top Subscription Plan
→ “2 Meal Kits/3” is the most popular 🔥
📊 𝗣𝗲𝗿𝗳𝗼𝗿𝗺𝗮𝗻𝗰𝗲 𝘃𝘀 𝗧𝗮𝗿𝗴𝗲𝘁
→ +𝟭𝟬.𝟲𝟮% 𝗥𝗲𝘃𝗲𝗻𝘂𝗲 𝗚𝗿𝗼𝘄𝘁𝗵
→ +𝟯𝟭.𝟱% 𝗦𝗵𝗶𝗽𝗺𝗲𝗻𝘁𝘀 𝗜𝗻𝗰𝗿𝗲𝗮𝘀𝗲
🛠️ What skills I used:
⚡ 𝗗𝗔𝗫 𝗠𝗮𝗴𝗶c – PM comparisons, targets vs actuals, ARPC
🔗 𝗗𝗮𝘁𝗮 𝗠𝗼𝗱𝗲𝗹𝗶𝗻𝗴 – connecting multiple datasets like a puzzle
🎨 𝗨𝗜/𝗨𝗫 𝗗𝗲𝘀𝗶𝗴𝗻 – clean dark theme for premium feel
💡 Why this project matters?
For me, data analytics isn’t just about charts…
It’s about answering:
👉 𝗪𝗵𝘆 𝗶𝘀 𝘁𝗵𝗶𝘀 𝗵𝗮𝗽𝗽𝗲𝗻𝗶𝗻𝗴?
👉 𝗪𝗵𝗲𝗿𝗲 𝗶𝘀 𝘁𝗵𝗲 𝗼𝗽𝗽𝗼𝗿𝘁𝘂𝗻𝗶𝘁𝘆?
👉 𝗪𝗵𝗮𝘁 𝘀𝗵𝗼𝘂𝗹𝗱 𝘁𝗵𝗲 𝗯𝘂𝘀𝗶𝗻𝗲𝘀𝘀 𝗱𝗼 𝗻𝗲𝘅𝘁?
And this dashboard does exactly that 💯
0
22
Austin Realty Insights
I built this interactive Power BI dashboard to explore Austin’s real estate market using a dataset of 15,171 properties.
I cleaned and transformed the data using Power Query, created DAX measures and KPIs, and built interactive visuals with cross-filtering and Key Influencers.
The main challenge was turning a large dataset with many attributes into a dashboard that stayed simple, useful, and easy to navigate.
Through this project, I strengthened my skills in Power BI, DAX, Power Query, data modeling, and business-focused data visualization.
Key result: Median property price of $405K, with insights into the factors associated with property values.
0
28
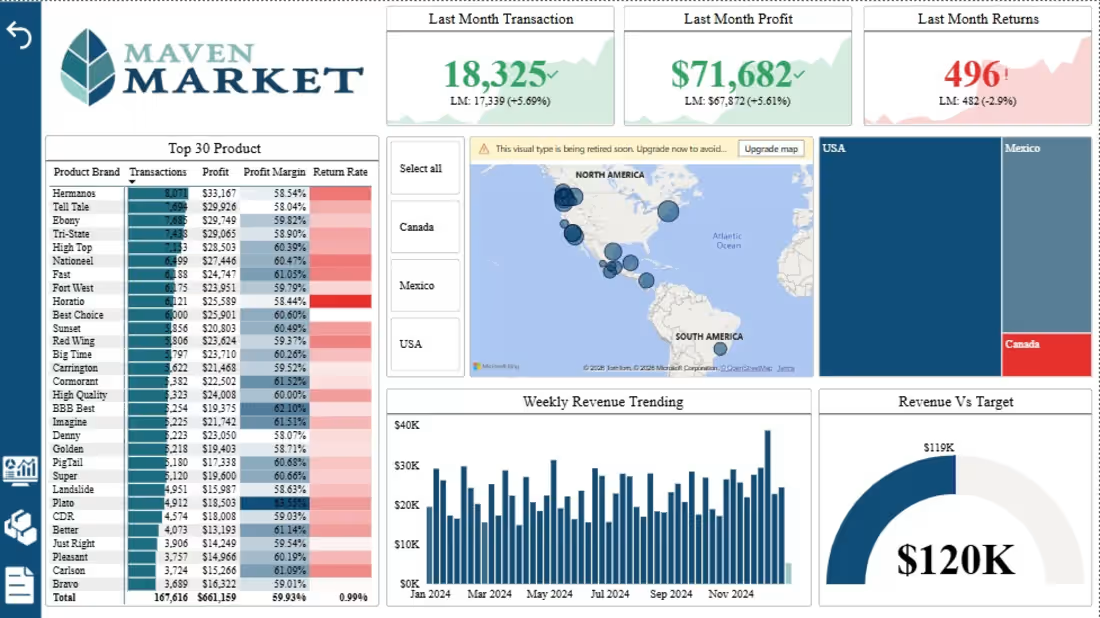
Built an interactive Power BI retail dashboard to analyze sales, profit, products, stores, and customer performance through clear and actionable insights.
1
53