The network for creativity
Join 1.25M professional creatives like you
Connect with clients, get discovered, and run your business 100% commission-free
Creatives on Contra have earned over $150M and we are just getting started
Back to feedPost

Austin Realty Insights
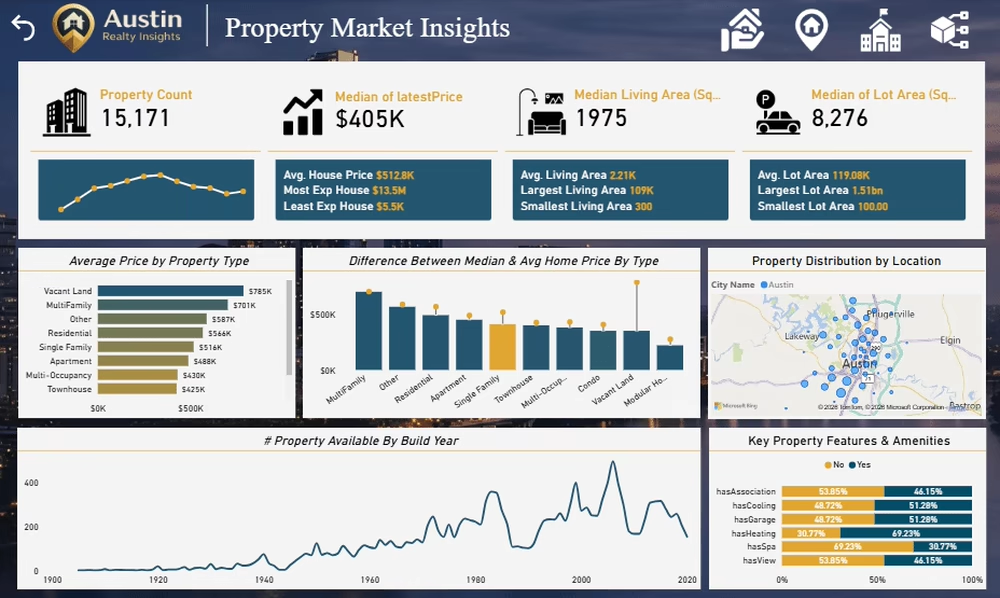
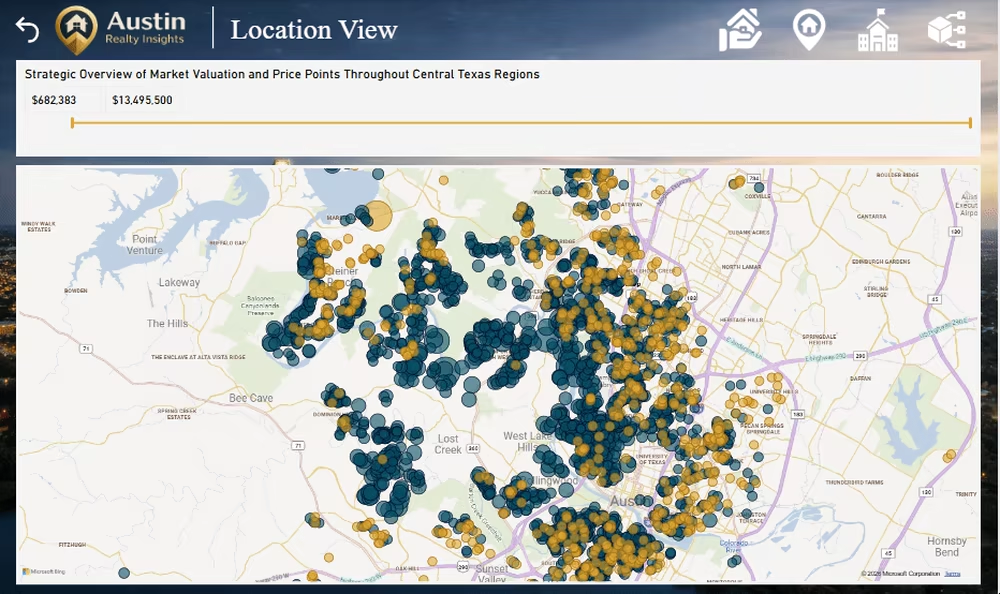
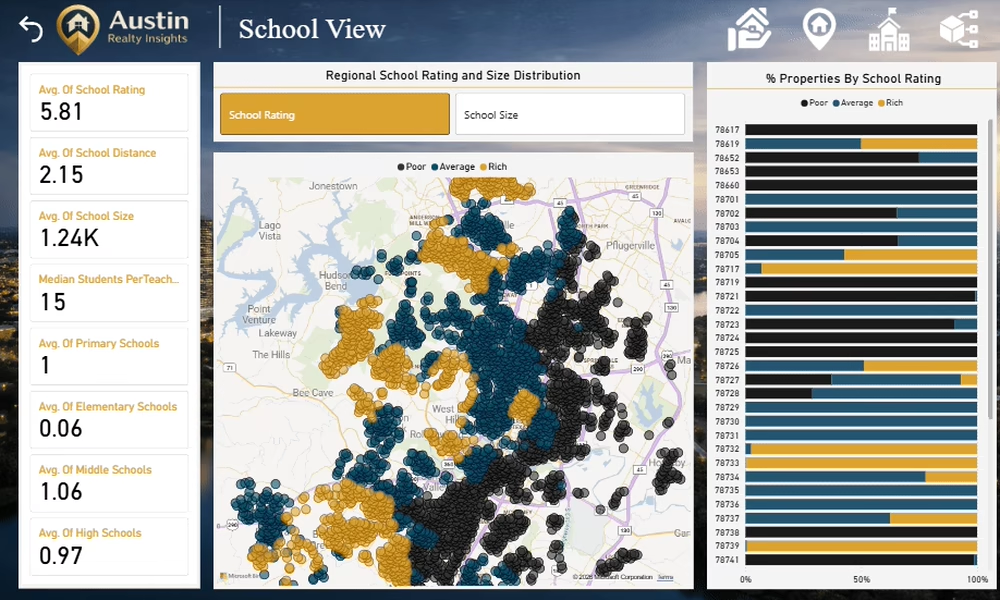
I built this interactive Power BI dashboard to explore Austin’s real estate market using a dataset of 15,171 properties.
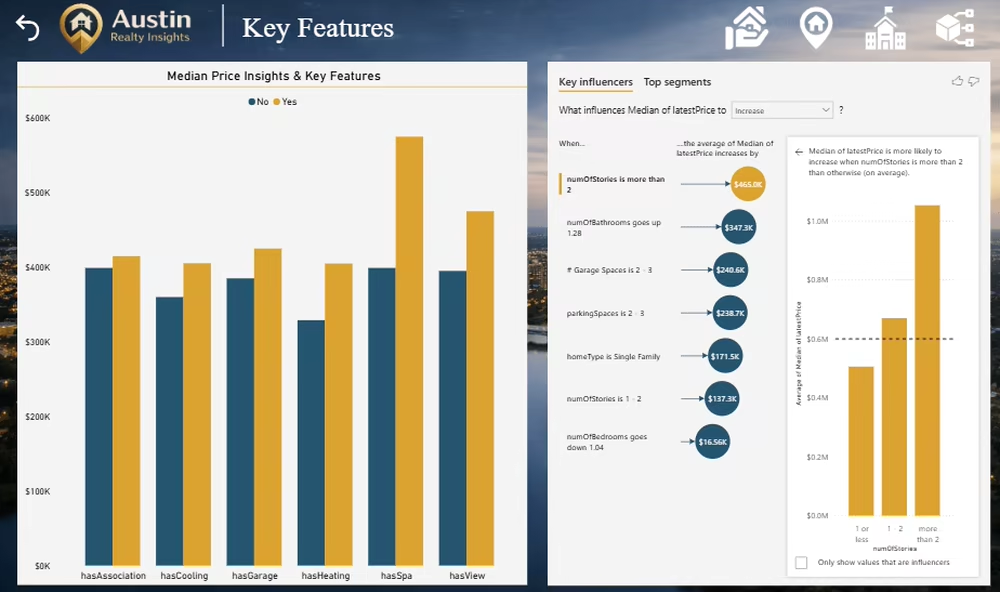
I cleaned and transformed the data using Power Query, created DAX measures and KPIs, and built interactive visuals with cross-filtering and Key Influencers.
The main challenge was turning a large dataset with many attributes into a dashboard that stayed simple, useful, and easy to navigate.
Through this project, I strengthened my skills in Power BI, DAX, Power Query, data modeling, and business-focused data visualization.
Key result: Median property price of $405K, with insights into the factors associated with property values.

The network for creativity
Join 1.25M professional creatives like you
Connect with clients, get discovered, and run your business 100% commission-free
Creatives on Contra have earned over $150M and we are just getting started




Related posts


What if managing real estate transactions could feel a lot less complicated?
That was the idea behind this project for Oun, an AI-powered platform built to help real estate agents and brokerages handle compliance, contracts, deadlines, and transaction coordination more efficiently.
I designed and developed the website in Webflow with a strong focus on making the product easy to understand, visually credible, and conversion-focused. From the product sections and SkySlope integration to the responsive layout and demo flow, every part of the experience was built to guide visitors from curiosity to action.
The final result is a clean, modern SaaS website that explains a complex product in a simple way and gives Oun a stronger digital presence.
#responsivedesign #webdesign #webdevelopment



The real estate project looks great! The features are well-built, the functionalities are well-organized, and the property listing design looks excellent.

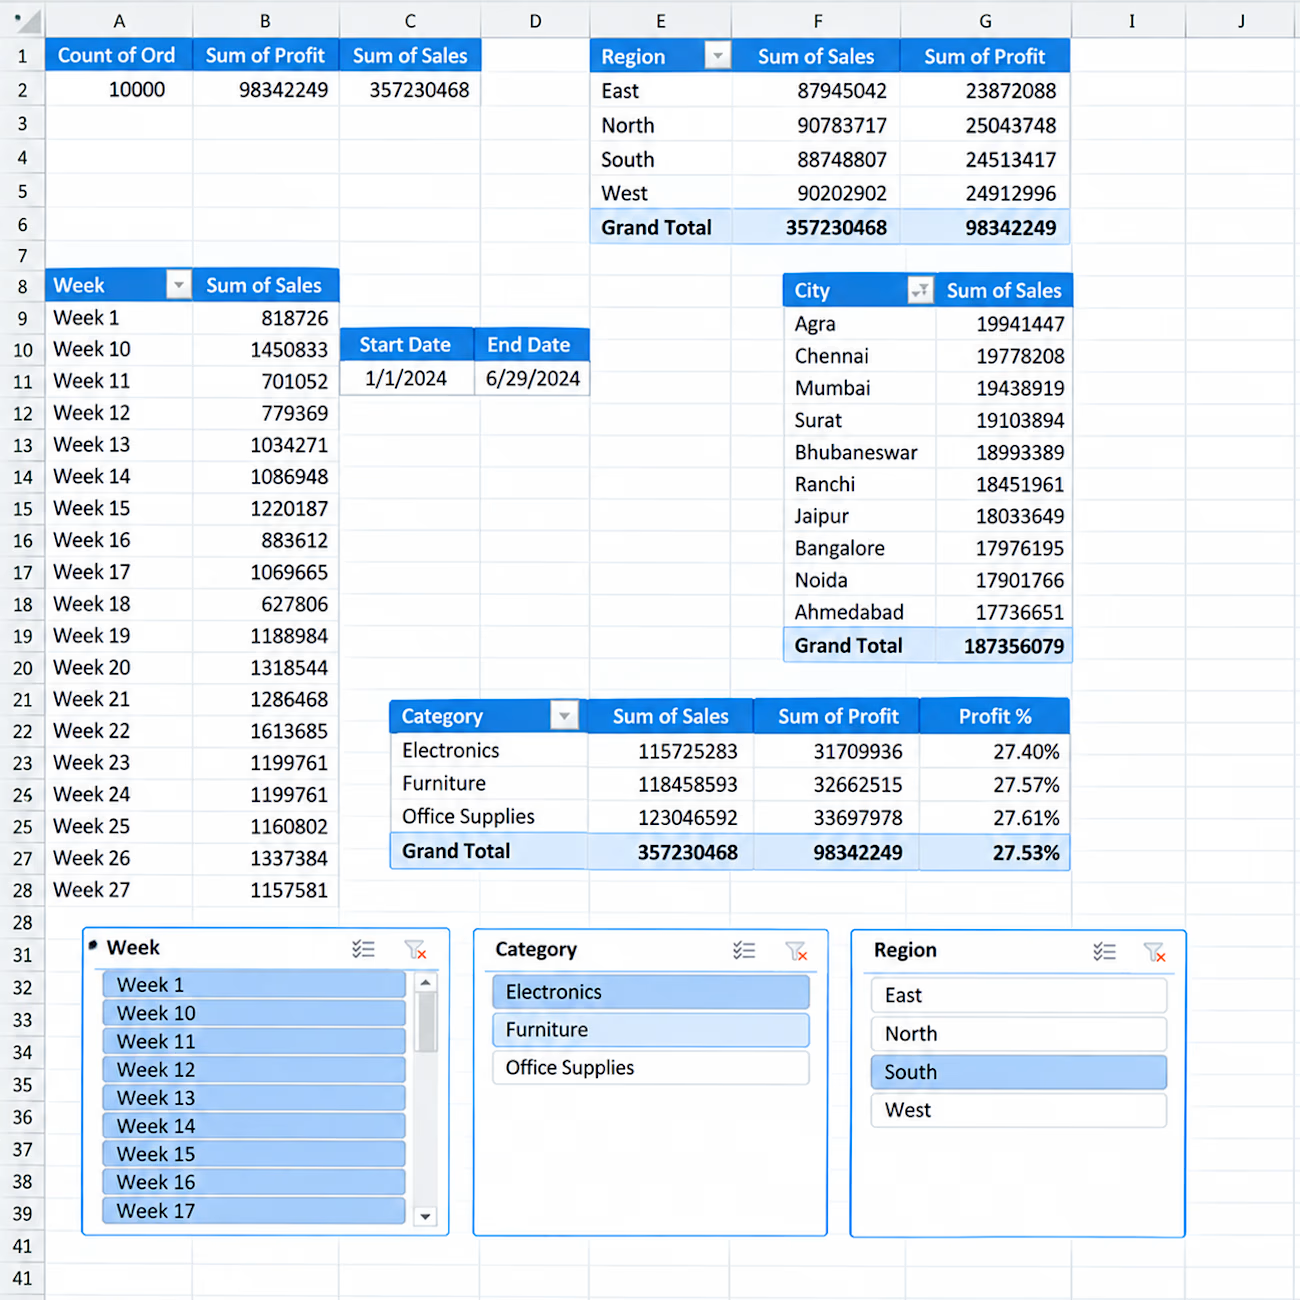
📊 Interactive Sales Analytics Dashboard in Excel
I created an interactive Excel dashboard to analyze sales performance across different business dimensions.
Key Insights & Features:
• Total Orders, Sales & Profit KPIs
• Sales & Profit by Region
• Sales by City
• Category-wise Sales, Profit & Profit %
• Weekly Sales Analysis
• Interactive Slicers for Week, Category & Region
• Start Date & End Date tracking
• PivotTable-based analysis
This dashboard is designed to turn raw sales data into clear and actionable business insights using Excel.


Hello.
I guess we're in the same page about data analysis and visualization


AI Data Assistant Inside Tableau
I built an AI-powered chatbot for Tableau that allows users to interact with their existing dashboards and data through natural-language questions.
Instead of manually navigating through multiple Tableau workbooks to find a specific metric or insight, users can ask the assistant what they need and receive relevant information from the available Tableau data and dashboards.
The solution adds a conversational AI layer directly to the existing BI workflow, helping users explore their data and find the right dashboard or report without changing how their Tableau environment is structured.


Can this system work outside Tableau? I think a client of mine would appreciate this