
Muhammad Sohail Tariq
Data Analyst Skilled in Excel and Power BI
- 1
- Followers


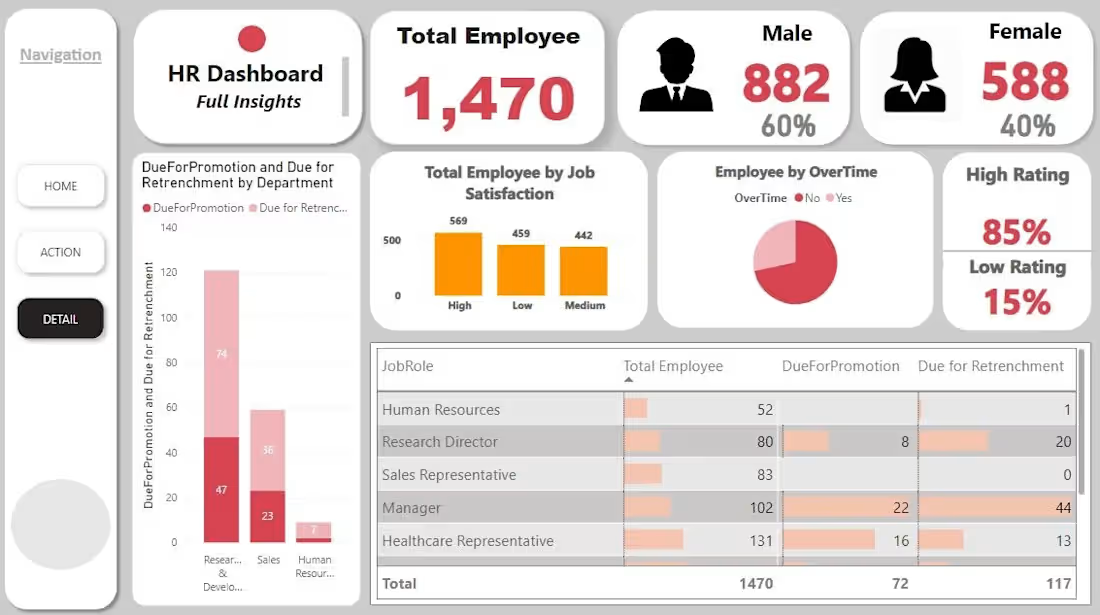
"Built a 3-page interactive HR Analytics Dashboard in Power BI with click-through navigation (Home → Detail → Action). Tracks 1,470 employees across gender split, job satisfaction, overtime, and performance ratings — with a drillable department view and named employee-level action lists for promotions and retrenchment. Goal: move HR from 'what's happening' to 'who to act on' in one click.
#PowerBI #DataAnalytics #HRAnalytics #DAX #DashboardDesign"
0
53

Helping businesses grow with data analysis, dashboards & insights.
Let’s build something impactful together.
0
46
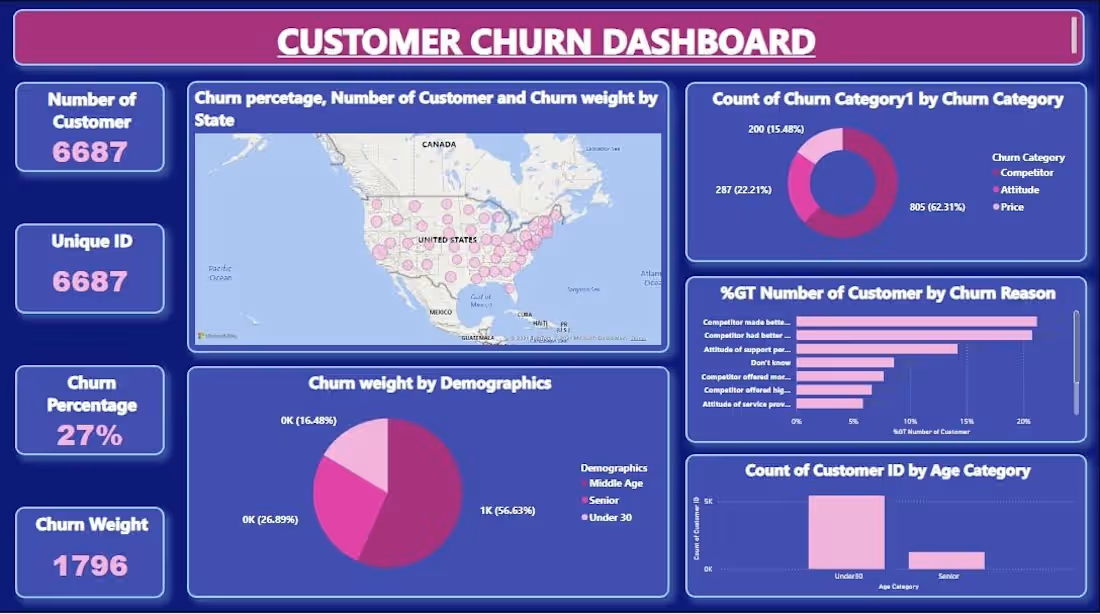
A Power BI dashboard built to analyze churn behavior across 6,687 customers for a business struggling with unclear retention insights. The dashboard combines geographic churn mapping, category-wise breakdown (Competitor, Attitude, Price), root-cause analysis by churn reason, and demographic segmentation by age group — all powered by Power Query for data modeling and DAX for calculated measures like churn percentage and churn weight. Key finding: price sensitivity drove 62% of churn, and customers under 30 represented the highest-risk segment at 56.6% of total churn weight. The result is a single-page, self-service view that lets stakeholders prioritize retention strategy by actual cause instead of guesswork.
2
0
236