The network for creativity
Join 1.25M professional creatives like you
Connect with clients, get discovered, and run your business 100% commission-free
Creatives on Contra have earned over $150M and we are just getting started
Back to feedPost

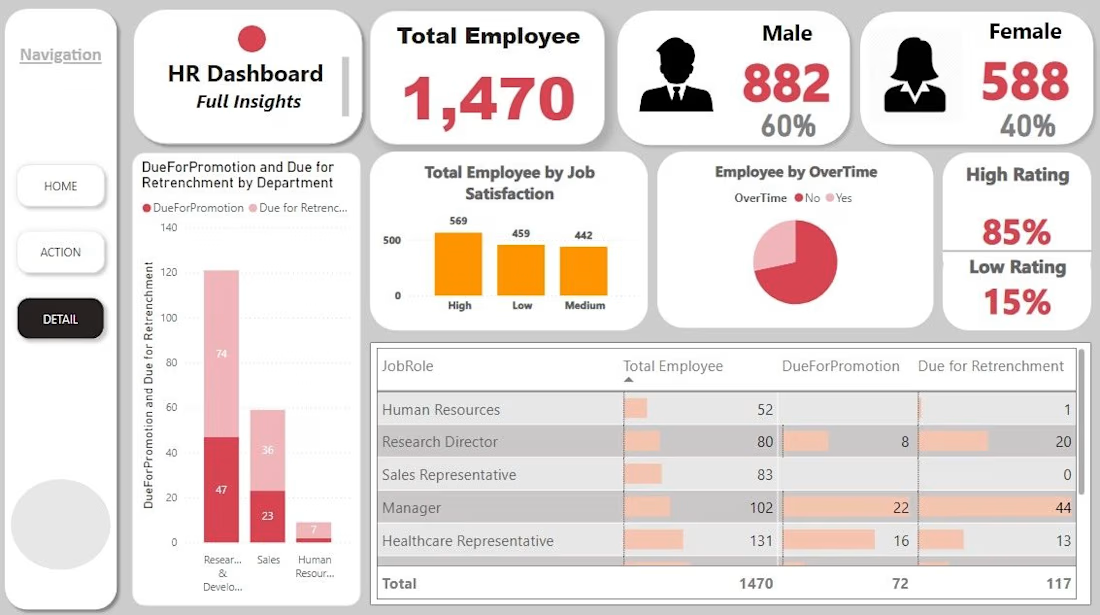
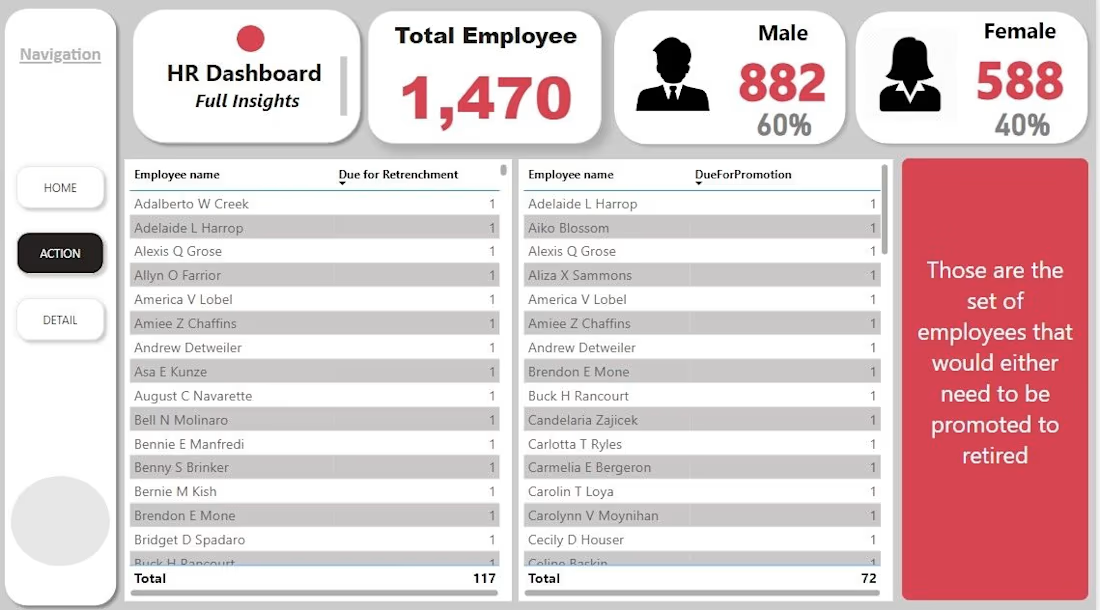
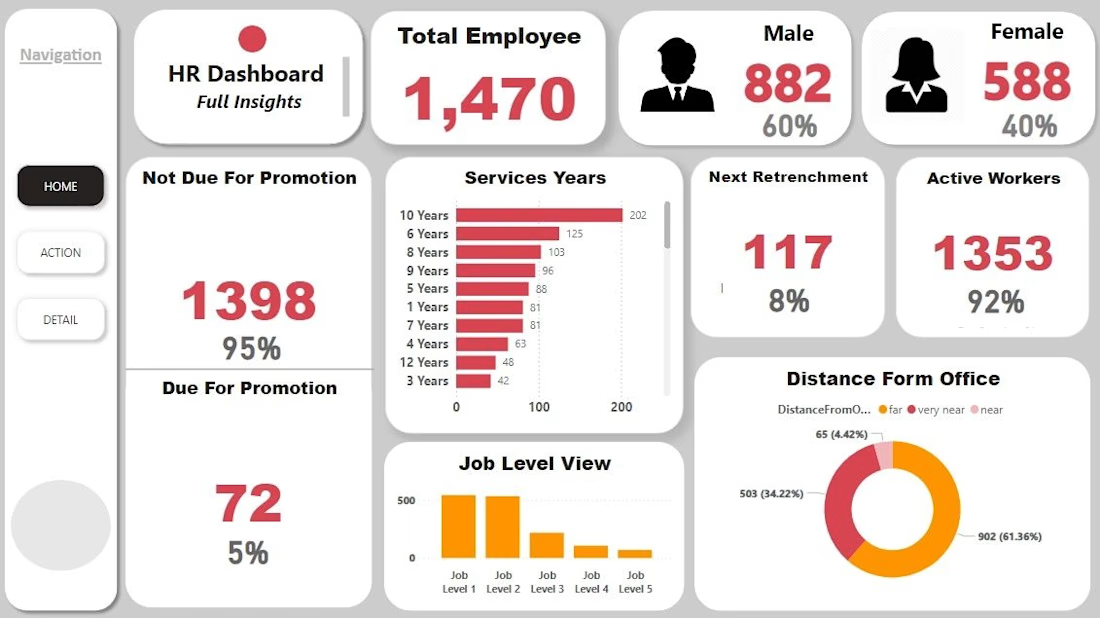
"Built a 3-page interactive HR Analytics Dashboard in Power BI with click-through navigation (Home → Detail → Action). Tracks 1,470 employees across gender split, job satisfaction, overtime, and performance ratings — with a drillable department view and named employee-level action lists for promotions and retrenchment. Goal: move HR from 'what's happening' to 'who to act on' in one click.
#PowerBI #DataAnalytics #HRAnalytics #DAX #DashboardDesign"

The network for creativity
Join 1.25M professional creatives like you
Connect with clients, get discovered, and run your business 100% commission-free
Creatives on Contra have earned over $150M and we are just getting started











Related posts

Exploring how complex financial data can feel simple, structured, and easy to navigate.
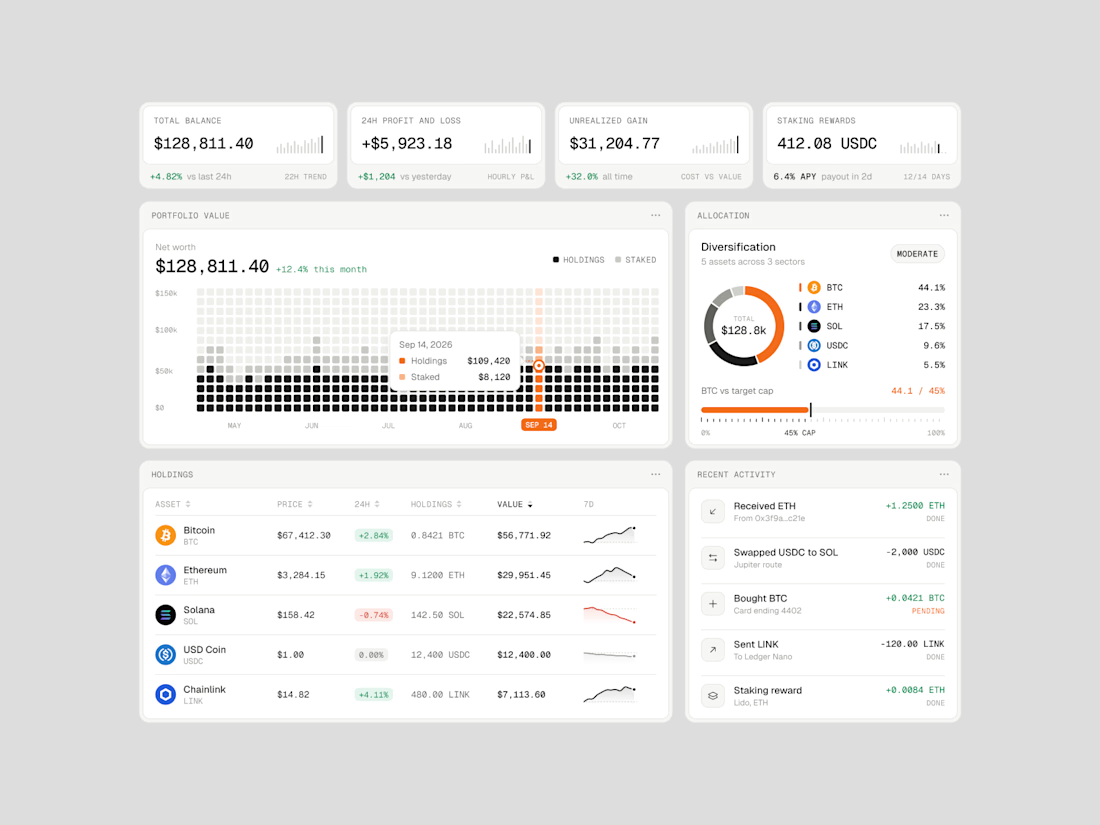
Vault One is a crypto portfolio dashboard concept that brings together asset performance, portfolio allocation, transaction history, and key financial metrics in one workspace.
I focused on visual hierarchy, information density, and data visualization, using a neutral color palette, subtle UI details, and selective accent colors to keep the interface clean without compromising functionality.
The goal was to make the data easier to understand, not just nicer to look at.
Would love to hear your thoughts on the visual direction and layout!
#ProductDesign #UIDesign #Fintech #DashboardDesign #UXDesign




What are your thoughts on the ongoing Power BI conversation?
In the meantime, lets have a look at this Marketing Analytics Dashboard.


Exploring a clean, modern SaaS dashboard UI. Focused on simple layouts, smooth interactions, and a better user experience 🚀


i had to like this, it got my attention, very nice build mate.