The network for creativity
Join 1.25M professional creatives like you
Connect with clients, get discovered, and run your business 100% commission-free
Creatives on Contra have earned over $150M and we are just getting started
Back to feedPost
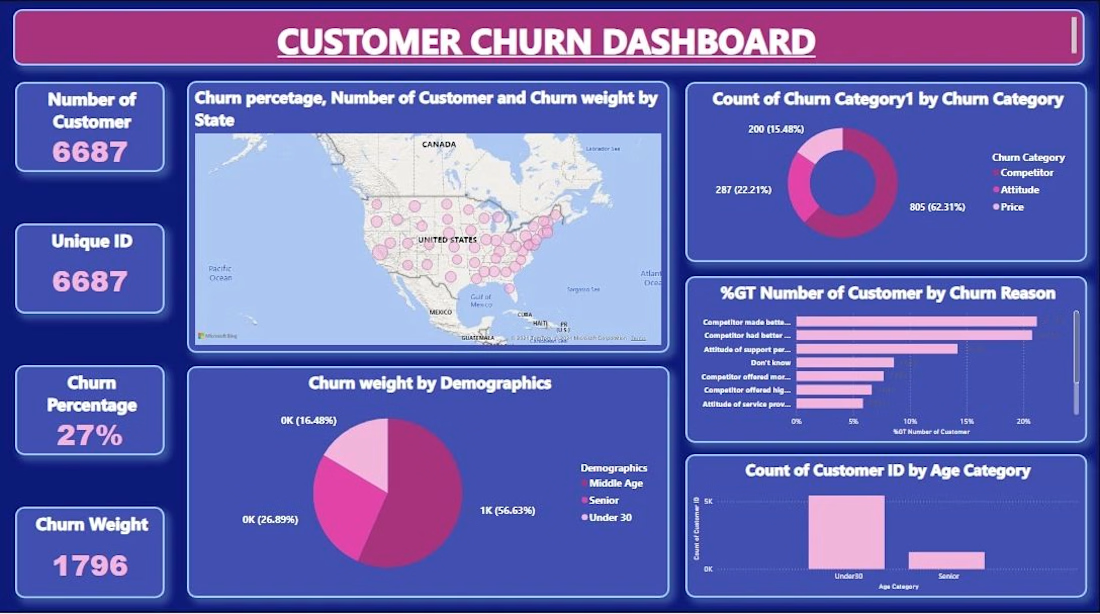
A Power BI dashboard built to analyze churn behavior across 6,687 customers for a business struggling with unclear retention insights. The dashboard combines geographic churn mapping, category-wise breakdown (Competitor, Attitude, Price), root-cause analysis by churn reason, and demographic segmentation by age group — all powered by Power Query for data modeling and DAX for calculated measures like churn percentage and churn weight. Key finding: price sensitivity drove 62% of churn, and customers under 30 represented the highest-risk segment at 56.6% of total churn weight. The result is a single-page, self-service view that lets stakeholders prioritize retention strategy by actual cause instead of guesswork.



thanks for feedback
The network for creativity
Join 1.25M professional creatives like you
Connect with clients, get discovered, and run your business 100% commission-free
Creatives on Contra have earned over $150M and we are just getting started











Related posts

How I Built an End-to-End Sales Analytics Dashboard in Excel for an E-commerce Company
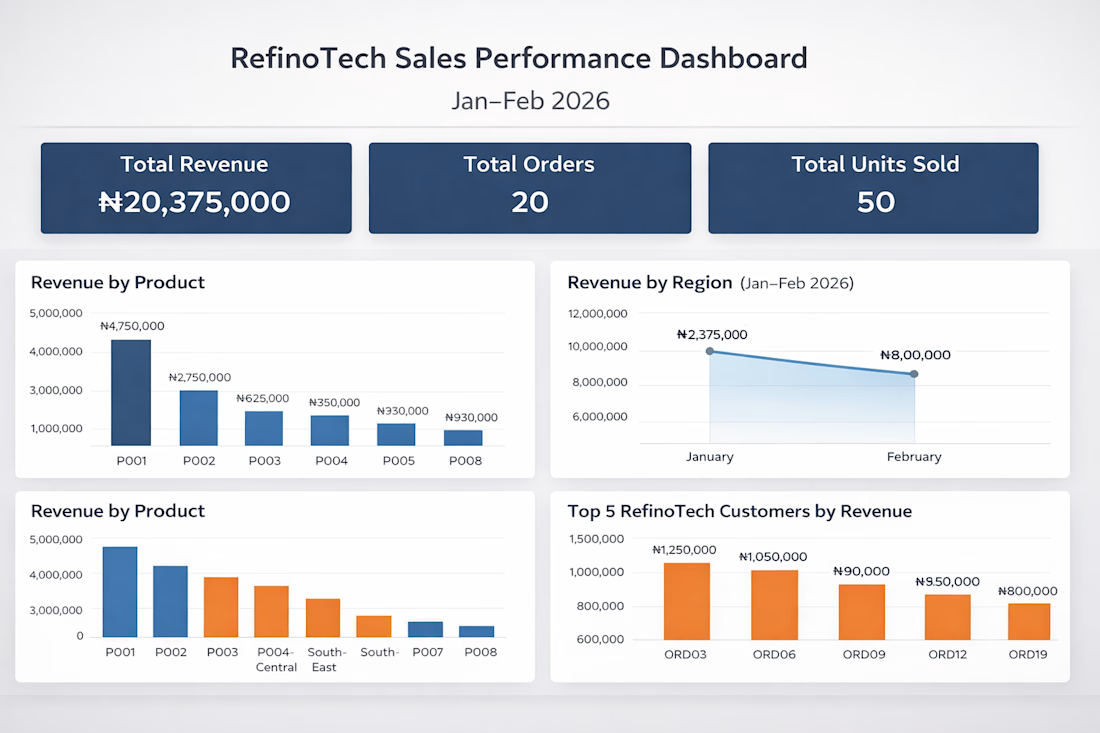
I recently completed an end-to-end sales analytics project using Microsoft Excel, transforming raw e-commerce sales data into an interactive dashboard that provides meaningful business insights.
In this project, I explored the data, performed analysis, identified key sales trends, and built an interactive dashboard to help businesses make data-driven decisions.
I documented the entire process, including the approach, tools, analysis, and dashboard development.
Read the full project walkthrough on Medium: https://medium.com/@Refino/how-i-built-an-end-to-end-sales-analytics-dashboard-in-excel-for-an-e-commerce-company-e8692d81f354



Excellent work! Turning raw data into actionable business insights is a valuable skill.

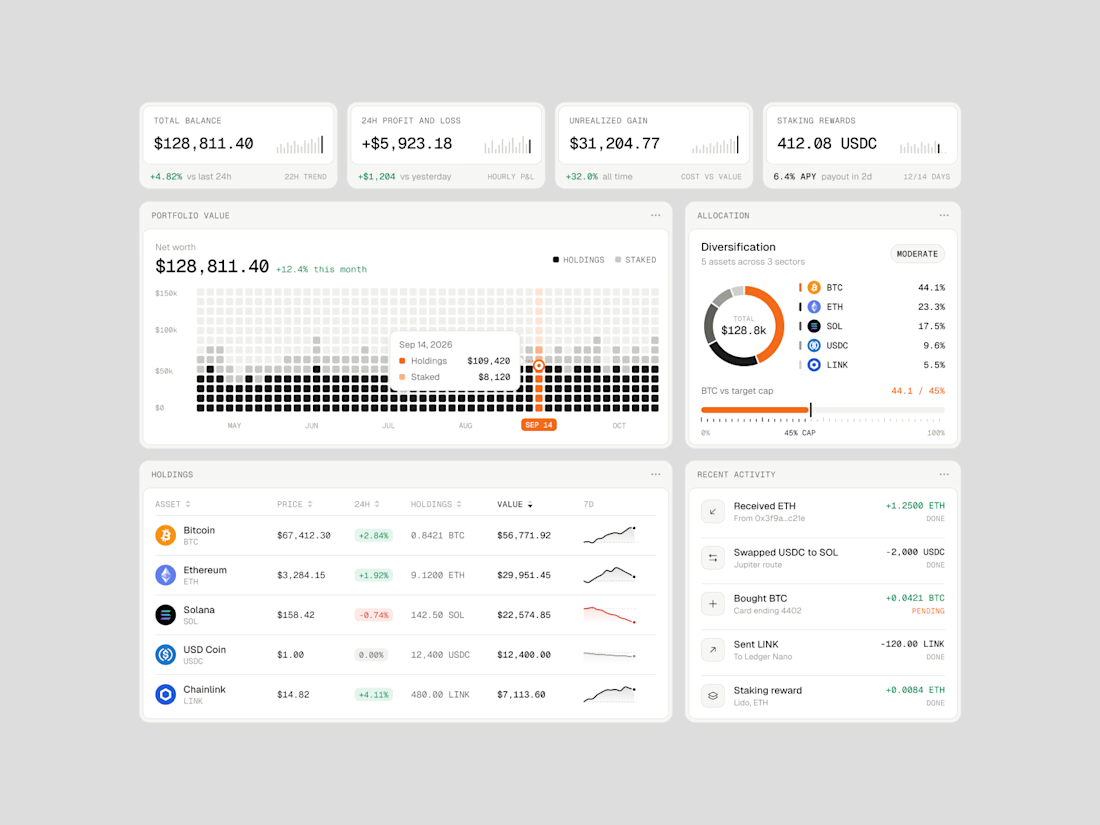
Exploring how complex financial data can feel simple, structured, and easy to navigate.
Vault One is a crypto portfolio dashboard concept that brings together asset performance, portfolio allocation, transaction history, and key financial metrics in one workspace.
I focused on visual hierarchy, information density, and data visualization, using a neutral color palette, subtle UI details, and selective accent colors to keep the interface clean without compromising functionality.
The goal was to make the data easier to understand, not just nicer to look at.
Would love to hear your thoughts on the visual direction and layout!
#ProductDesign #UIDesign #Fintech #DashboardDesign #UXDesign




Exploring a clean, modern SaaS dashboard UI. Focused on simple layouts, smooth interactions, and a better user experience 🚀


i had to like this, it got my attention, very nice build mate.