
shital Bhal
Data Analyst , Power BI & Excel Dashboard Specialist
New to Contra
shital is building their profile!

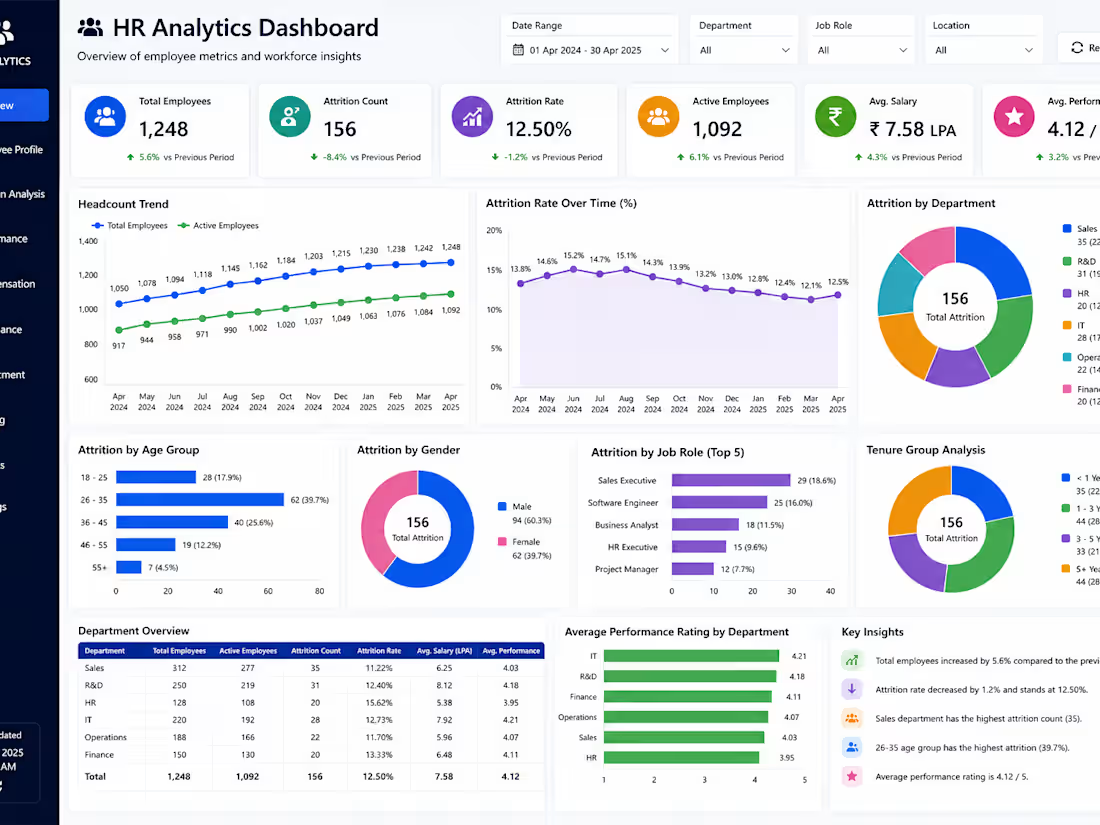
Project Title: HR Analytics & Workforce Insights Dashboard
1. Project Overview
This project is an interactive HR Analytics Dashboard designed to track workforce growth, salary distributions, attrition trends, and performance metrics across departments. It helps HR leaders and executives make data-driven decisions to improve employee retention and operational efficiency.
2. Key Features & Business Insights Built
Workforce Growth Tracking: Visualized total headcount growth (+5.6%) and active employee ratios across a 12-month period.
Attrition Analysis: Identified critical turnover hotspots—showing that the 26–35 age group accounts for 39.7% of total attrition, with Sales and R&D experiencing the highest departure counts.
Department Performance & Salary Mapping: Structured a comparative breakdown showing high performance in IT (4.21/5) alongside salary distributions (ranging from ₹5.38 LPA in HR to ₹8.12 LPA in R&D).
Executive Summaries: Embedded quick-insight callouts highlighting top trends for fast decision-making.
3. Tools & Technologies Used
Data Visualization: Power BI Dashboard
Data Preparation: Python (Pandas) Data Model
4. My Role & Impact
Cleaned and structured complex workforce dataset containing 1,200+ employee records.
Translated raw HR metrics into actionable retention strategies focused on mid-career talent.
0
23
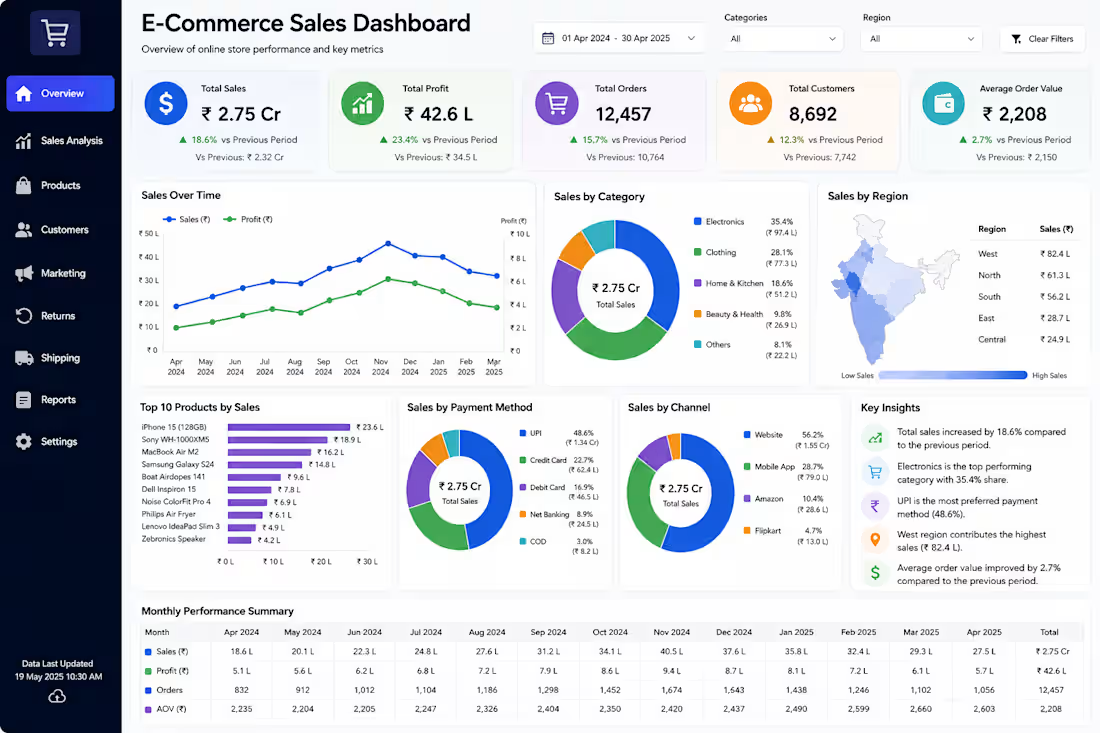
Interactive E-Commerce Sales Performance Dashboard
Excited to share a recent Data Analytics project focused on the E-Commerce sector. This comprehensive dashboard provides a holistic view of business health, transforming raw sales data into actionable insights for strategic decision-making.
What this dashboard shows:
1 Current vs Previous period comparison for Sales (2.75 Cr) and Profit.
2 Detailed analysis of Top 10 Products, Category breakdown, and Regional sales.
3 Key insights into monthly trends, channel performance, and AOV.
By automating data transformation and visualization, this solution, this solution helps businesses reduce manual reporting time by 70% and make faster, data-driven decisions.
0
23