
Samuel Doane
Python automation & interactive data reports
New to Contra
Samuel is ready for their next project!
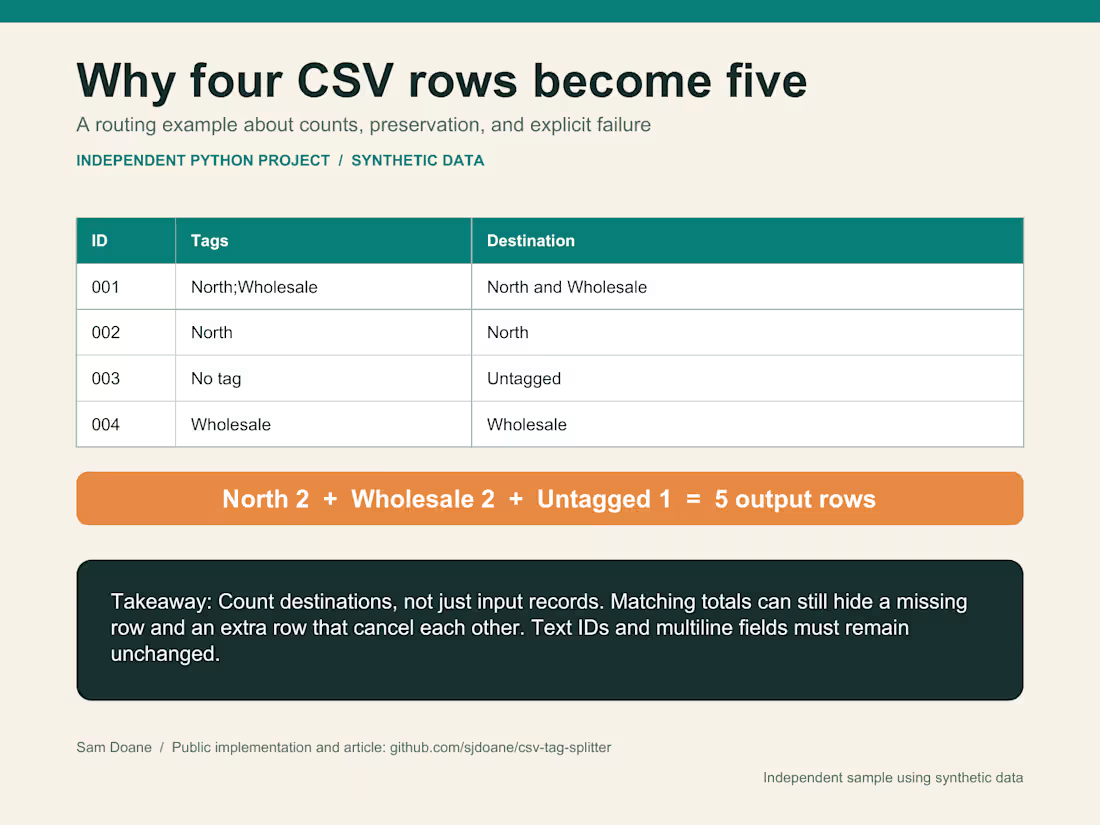
I wrote this practical article around a reproducible four-record example. It shows why a correct multi-tag split can produce five output rows, how matching totals can still hide a dropped record, and why text IDs and multiline fields need preservation checks. The Python implementation and synthetic fixtures are public.
Read the article: https://github.com/sjdoane/csv-tag-splitter/blob/main/articles/why-four-csv-rows-become-five.md
1
30
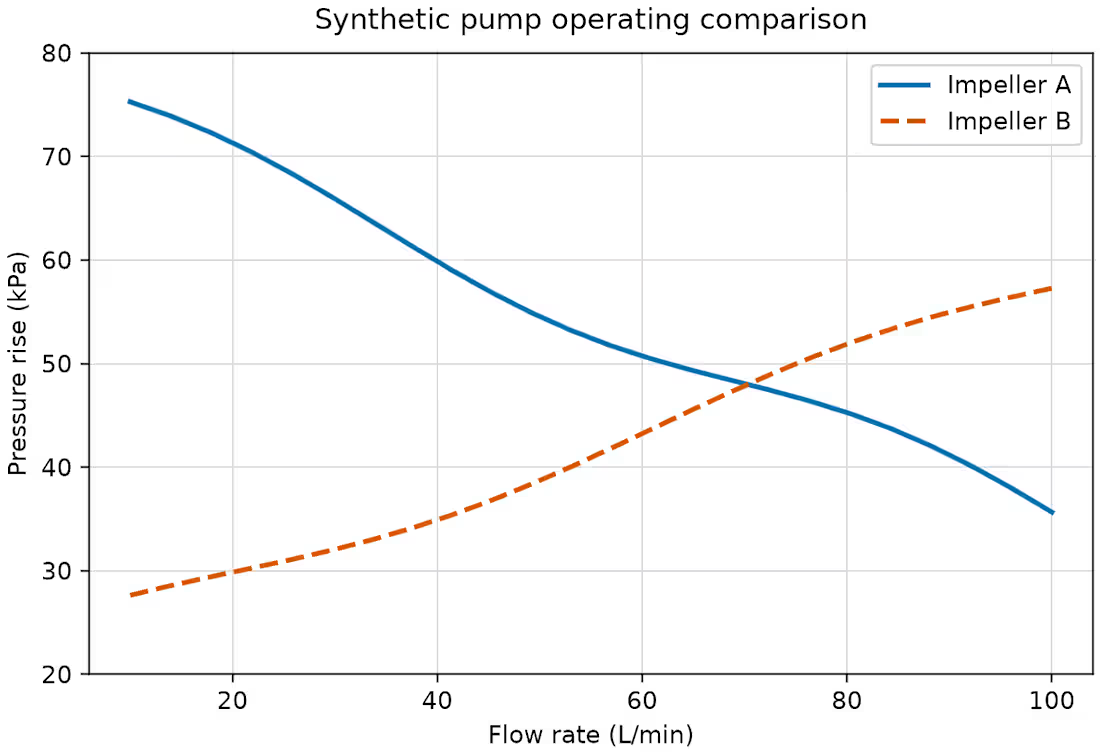
A synthetic engineering chart created in Python and Matplotlib for a chart-to-data extraction benchmark.
Two crossing series stay distinguishable through colour and line style, with units shown on both axes. The underlying clean vector-PDF test recovered all 48 plotted vertices without a segment mismatch. This controlled example does not establish performance on scanned or arbitrary charts, and it is not measured pump data.
0
23
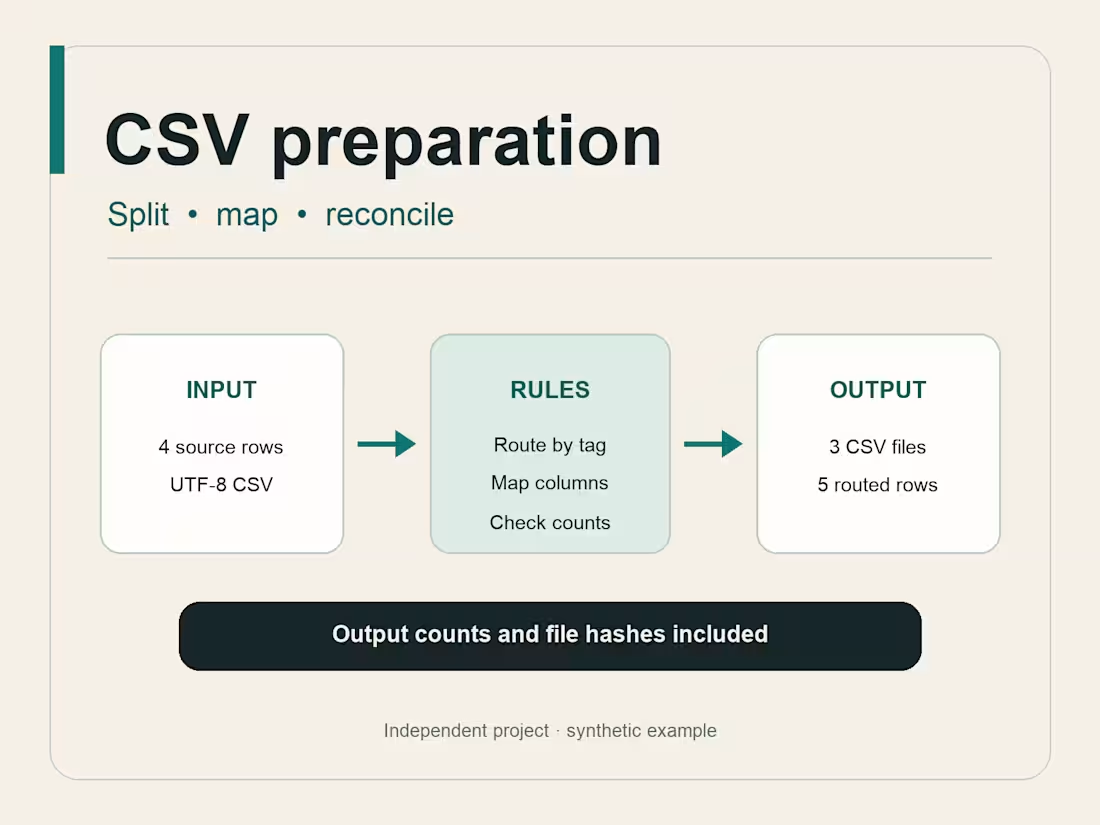
CSV preparation — an independent Python workflow for splitting tagged records and mapping columns to a supplied schema.
The synthetic example preserves text IDs and multiline fields, stops on unknown tags, and reports output counts and file hashes. Multi-tag routing is explicit, so extra output rows can be explained rather than mistaken for duplicates.
Code and worked example: https://github.com/sjdoane/csv-tag-splitter
2
114
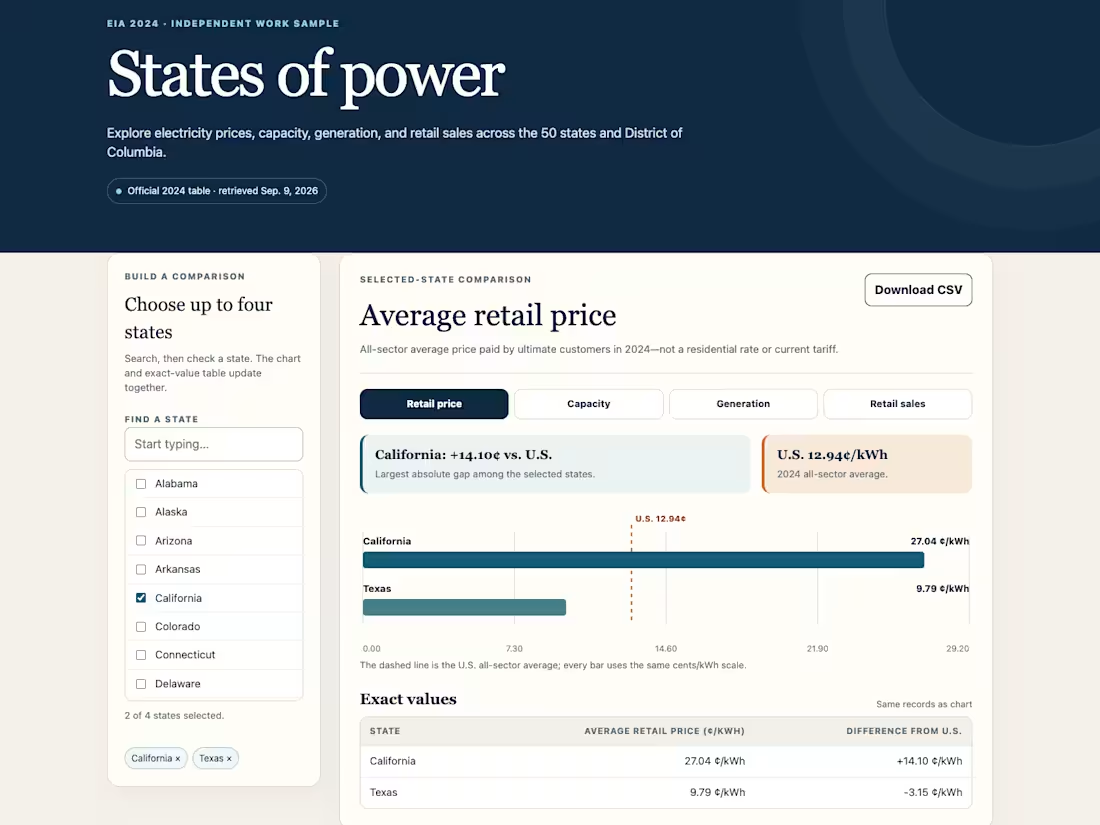
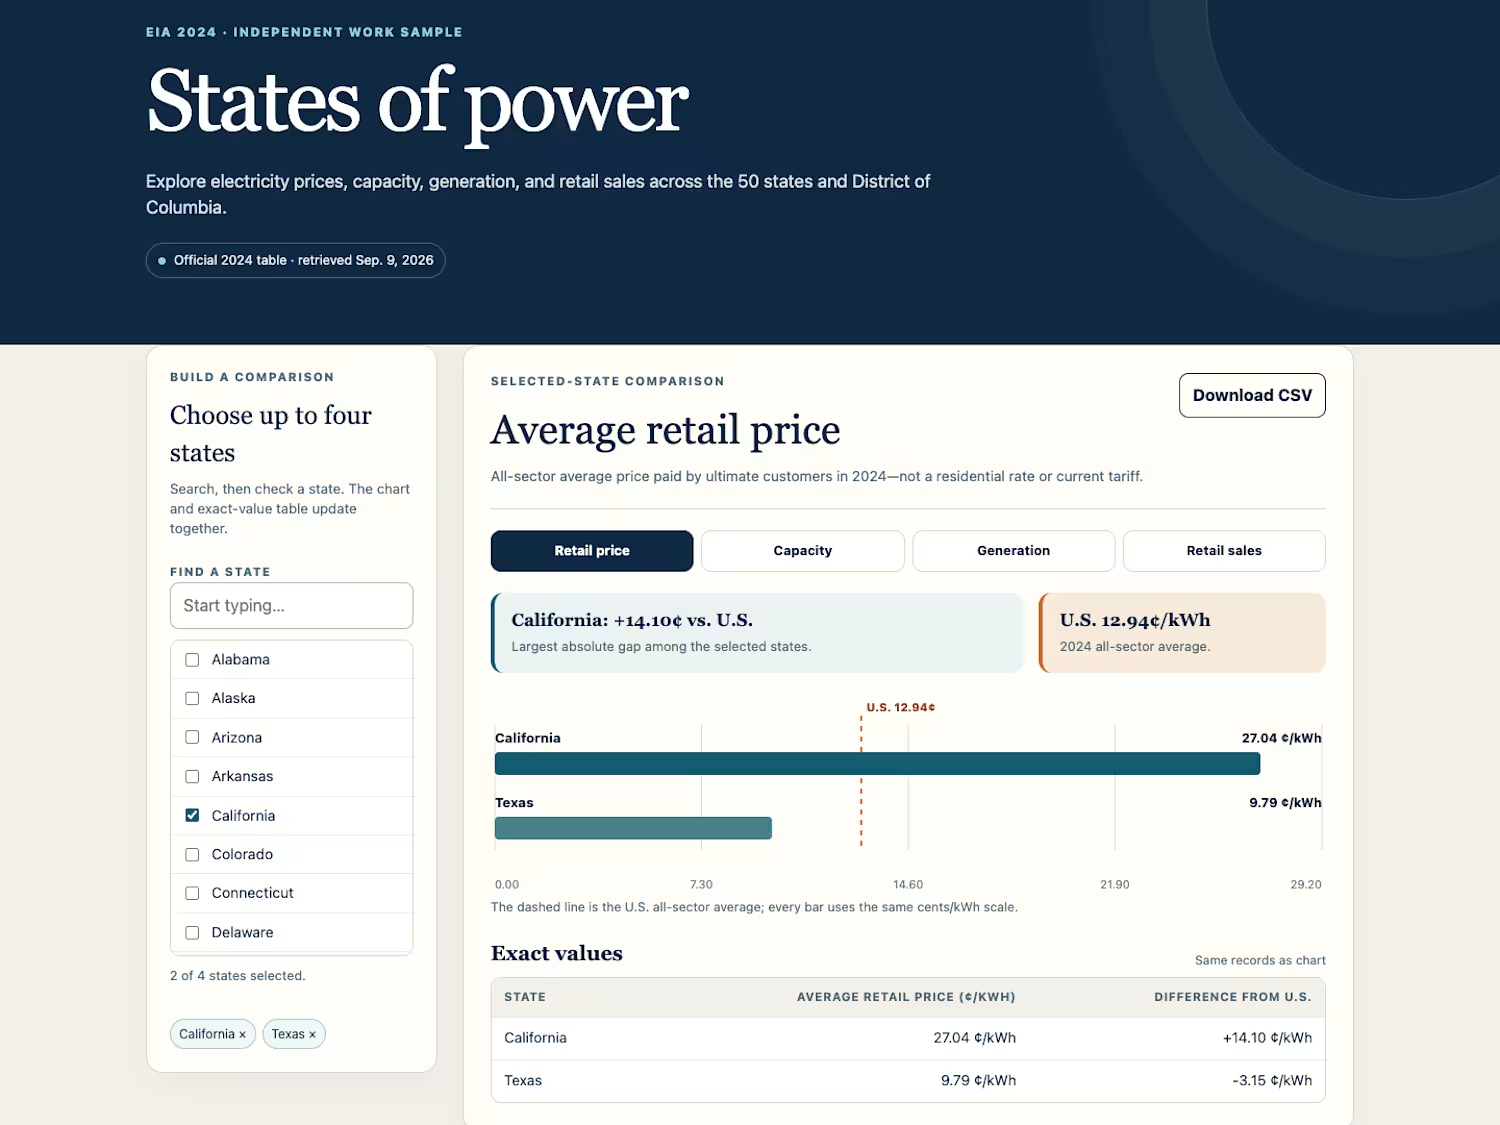
States of Power — an independent interactive report using public 2024 U.S. Energy Information Administration data.
Compare state electricity figures through an interactive chart, exact-value table, CSV export and source notes. This is a fixed data sample, not a live feed or forecast.
Explore it: https://states-of-power-sample.samueljackdoane.chatgpt.site/
0
20